Running and Debugging the Project with the HEW2 Debugger
This section of the tutorial explains how to execute/debug projects using HEW2’s integrated debugger. Users of HEW v1.x and HDI may instead prefer to see Running and Debugging the Project with the HDI Debugging Interface.
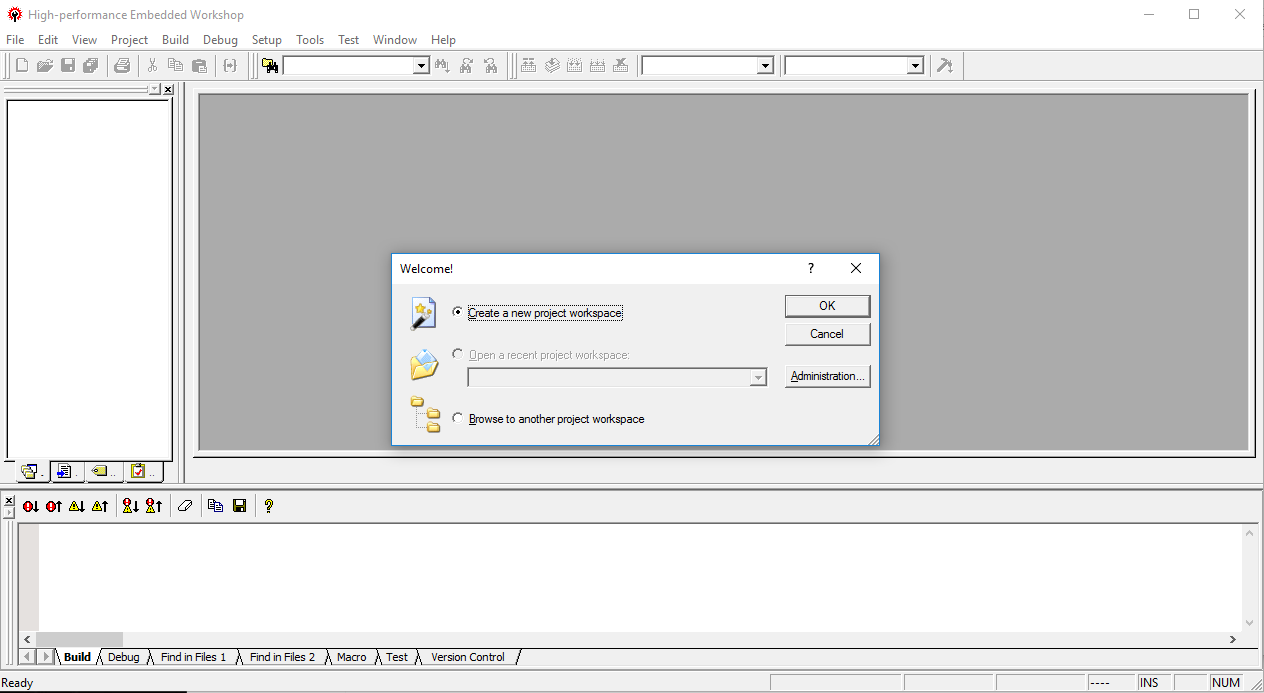
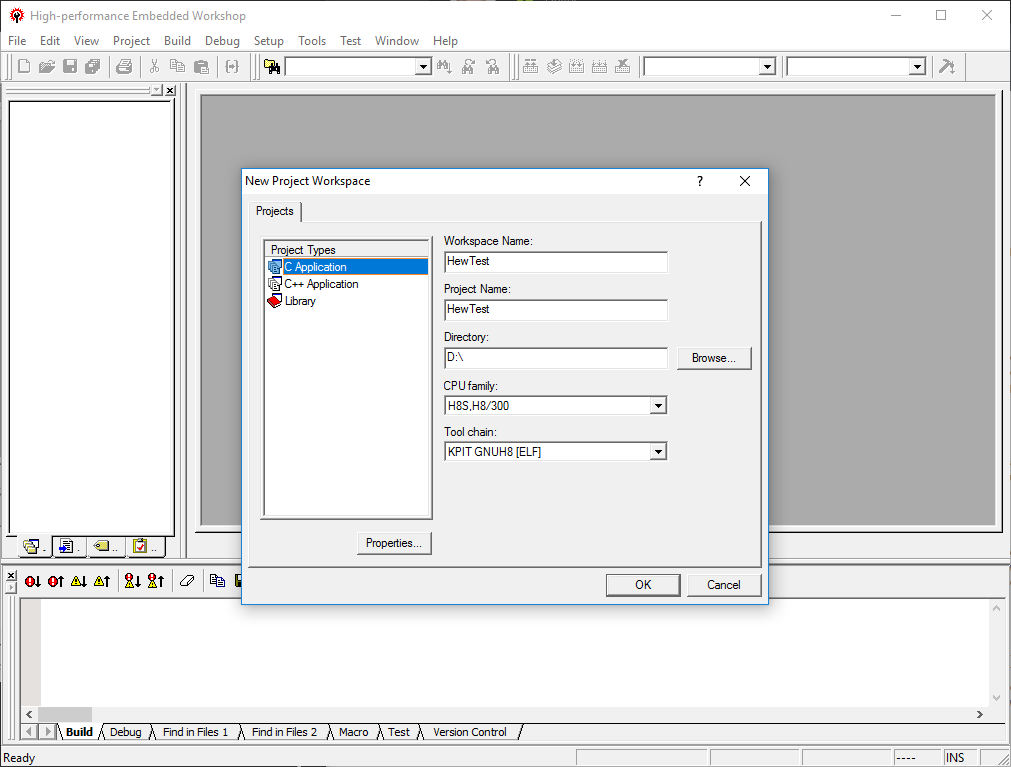
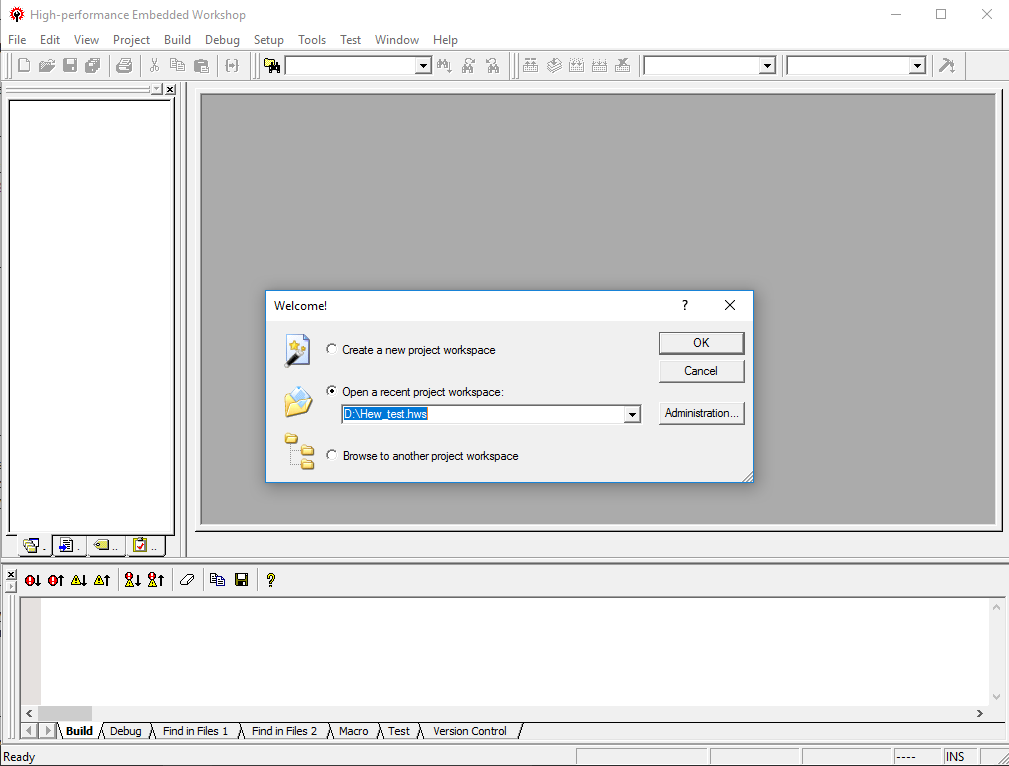
If you haven’t done so already, launch HEW2 and load the tutorial project workspace from “D:\”. Ensure the “Debug” configuration is selected and the project has been built see Building a Sample Project for Renesas H8 with HEW for full details).
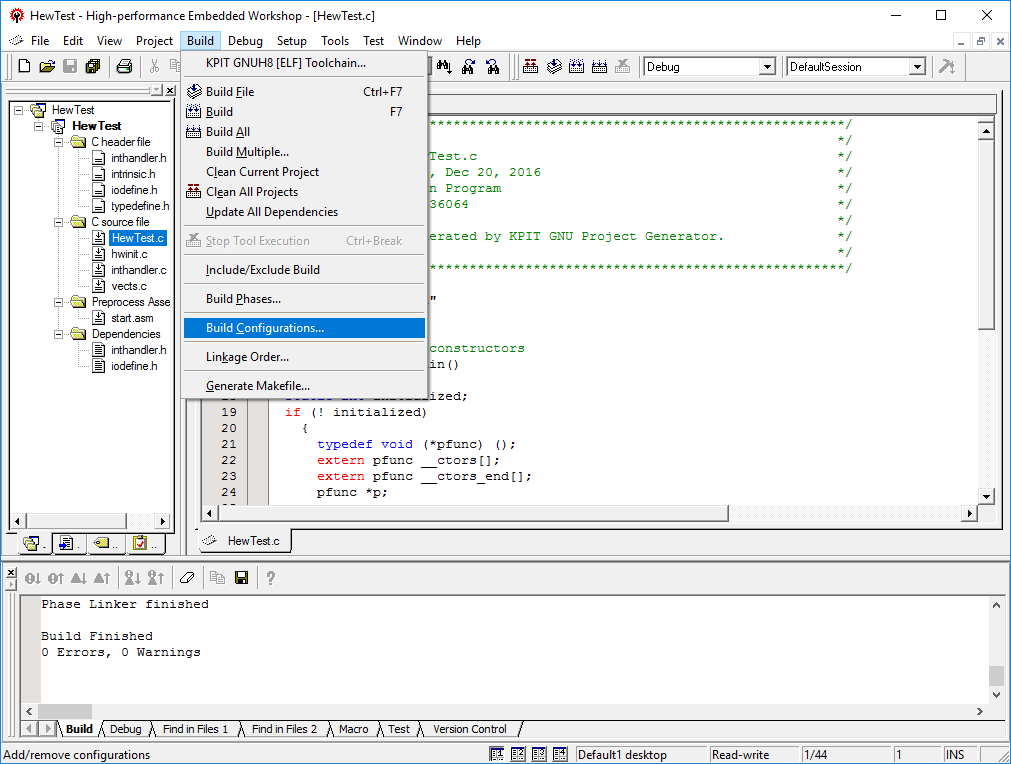
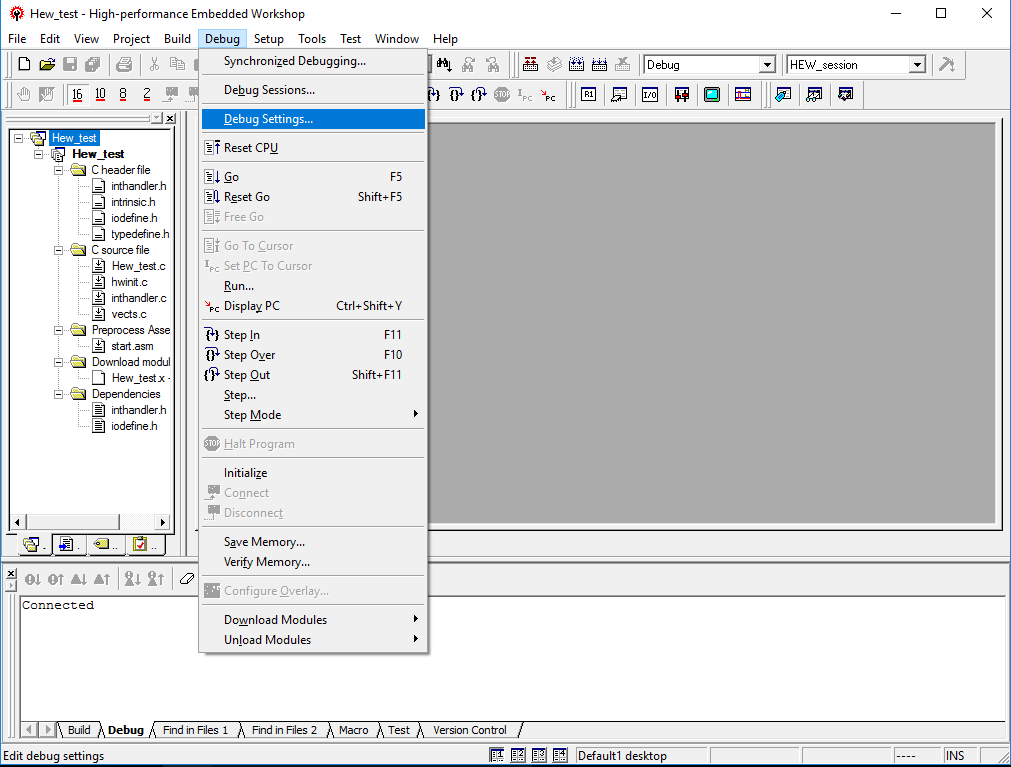
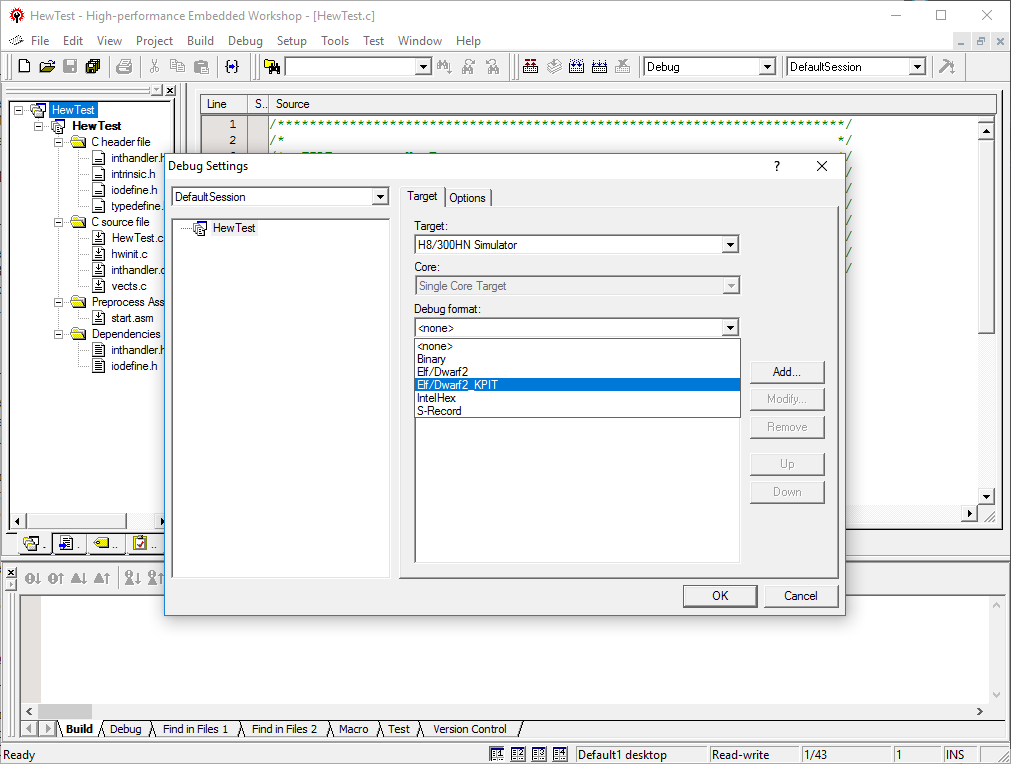
Select the “Debug Settings” item from the “Debug” menu on the menu bar.
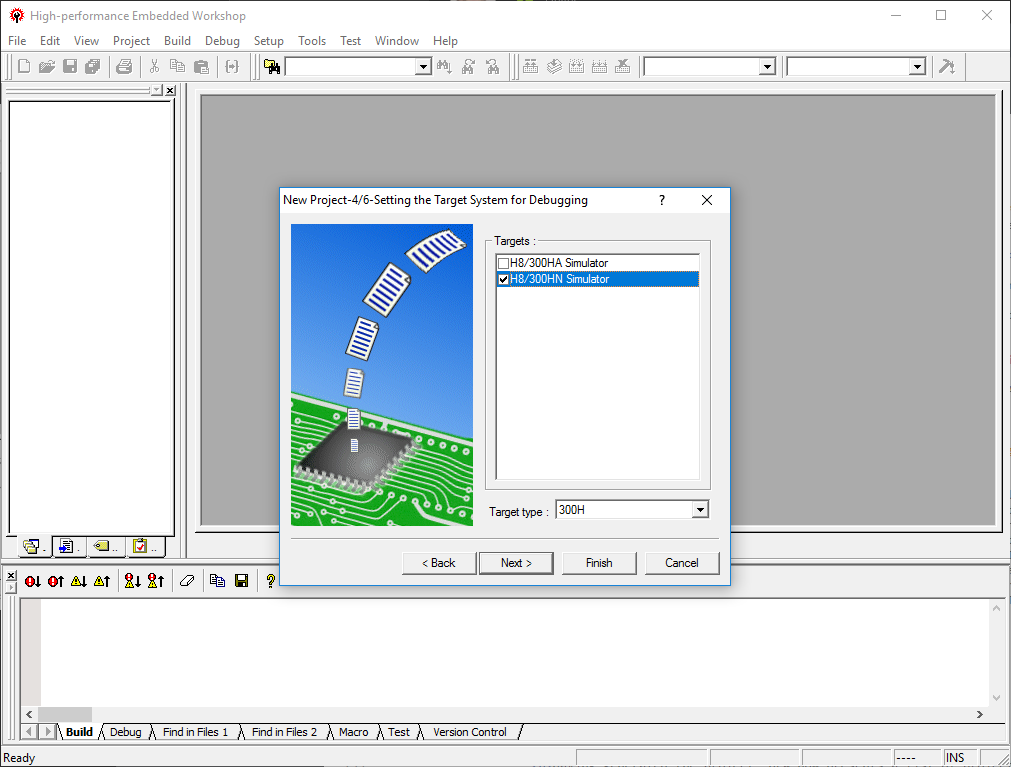
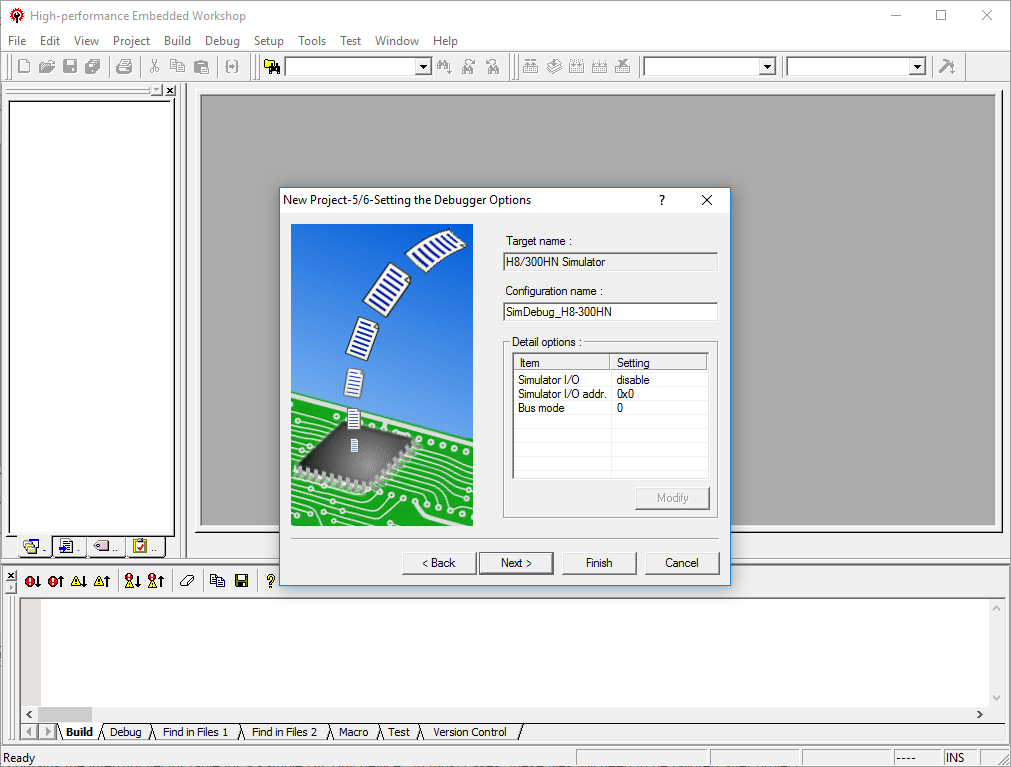
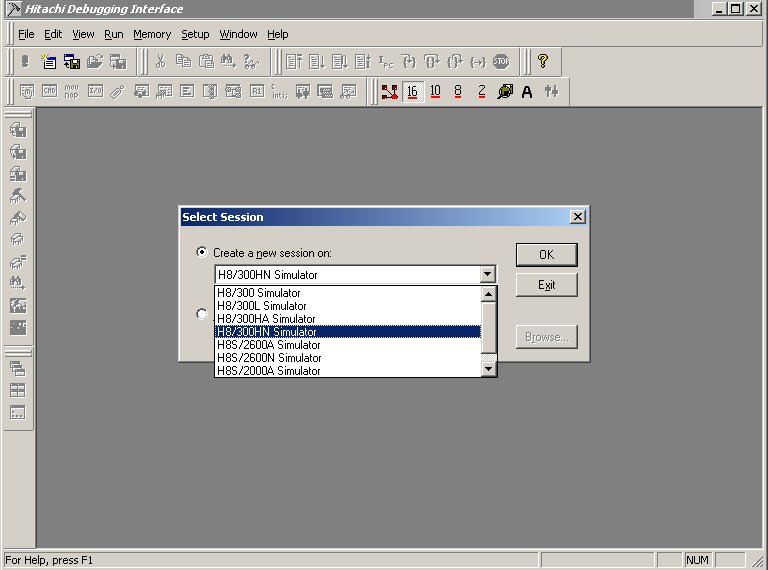
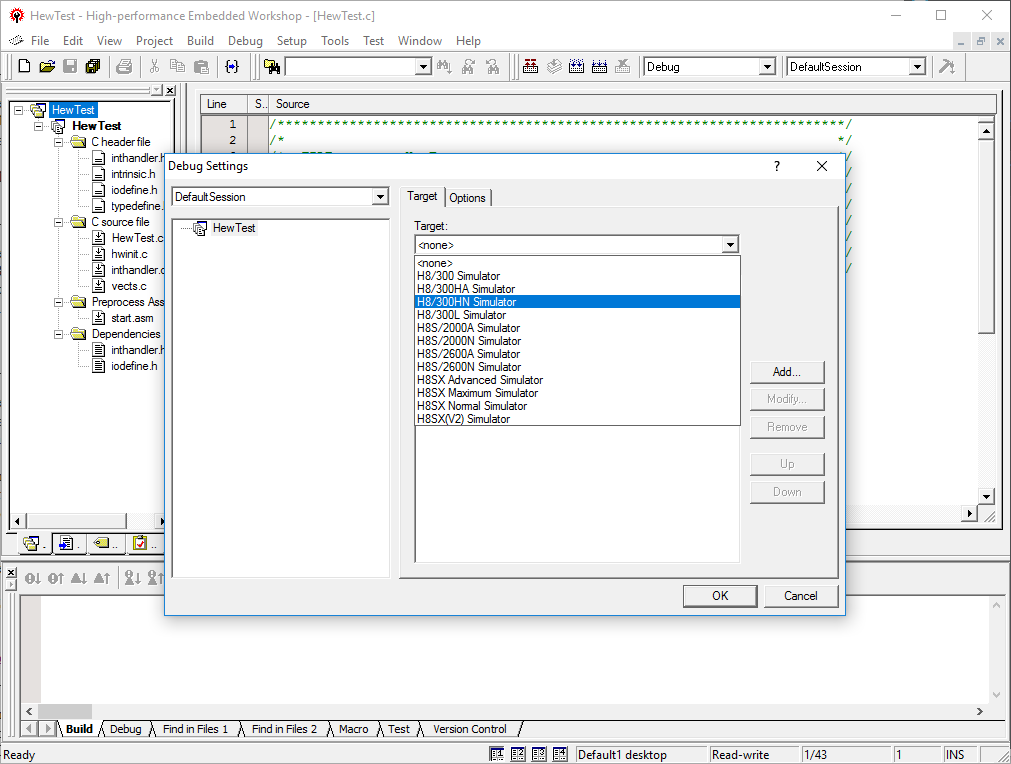
In the “Debug Settings” dialog box that appears, select the “Target”. For simplicity, we will use a simulator rather than actual hardware. As our project was built for a sample H8 device, the H8/300HN simulator should be selected (“H8/300HN Simulator”). HEW2 will warn you that “Target options will be emptied if you change the target”. Click “Yes” to proceed.
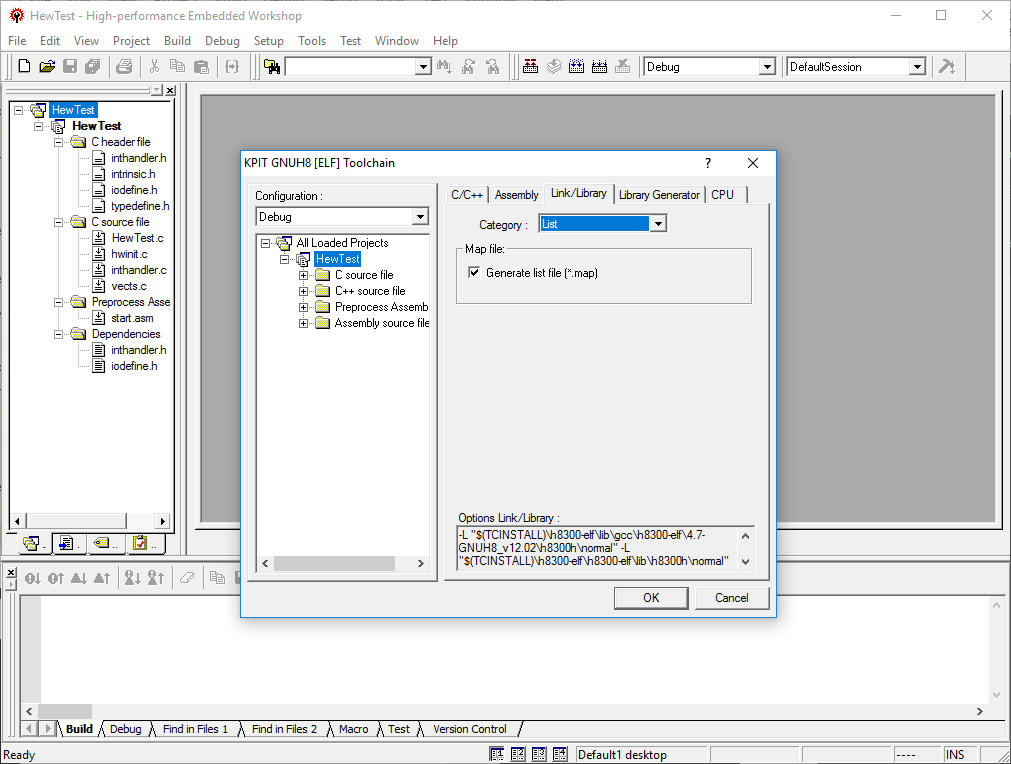
Now select the “Default Format”. Be sure to select the “Elf/Dwarf2 KPIT” option as any other selection, including “Elf/Dwarf2” is incorrect and may cause HEW2 to become unstable or read the debug information in your project file incorrectly.
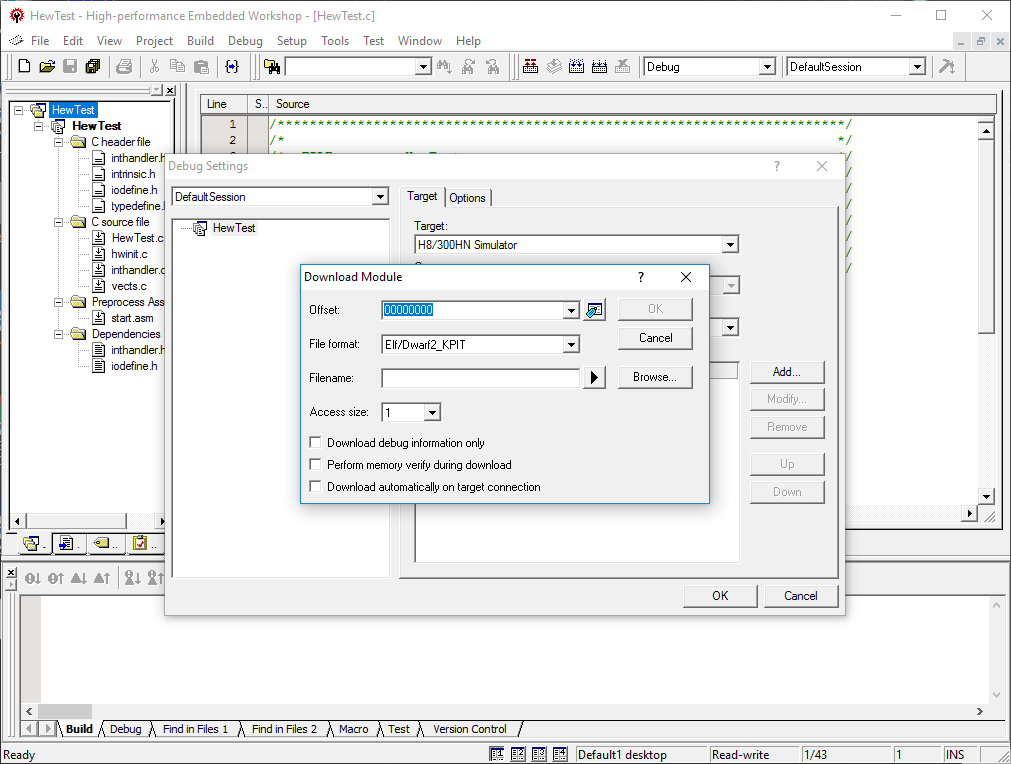
Next we will inform HEW2 of the application we wish to debug. Click the “Add” button on the “Debug Settings” dialog box. This will cause a “Download Module” dialog box to be displayed.
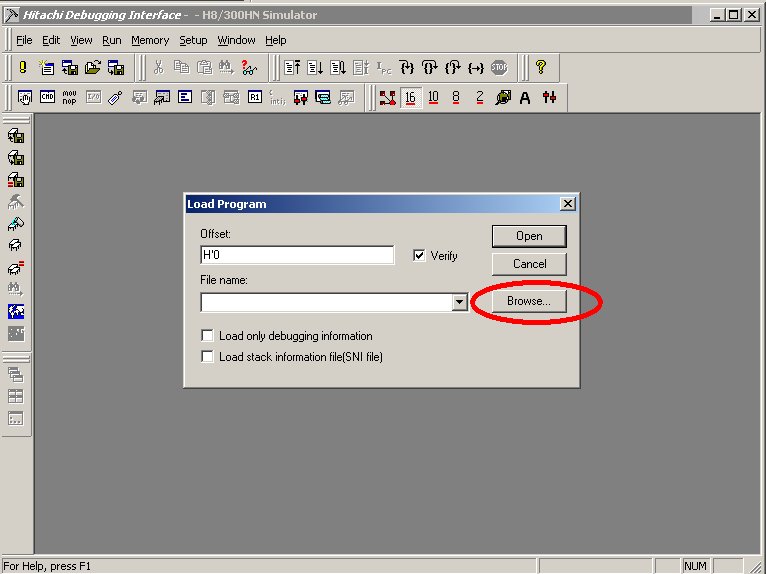
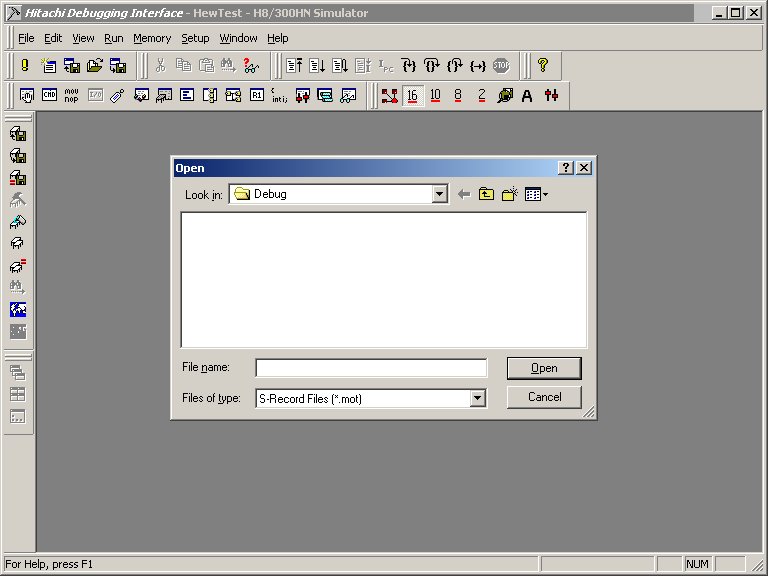
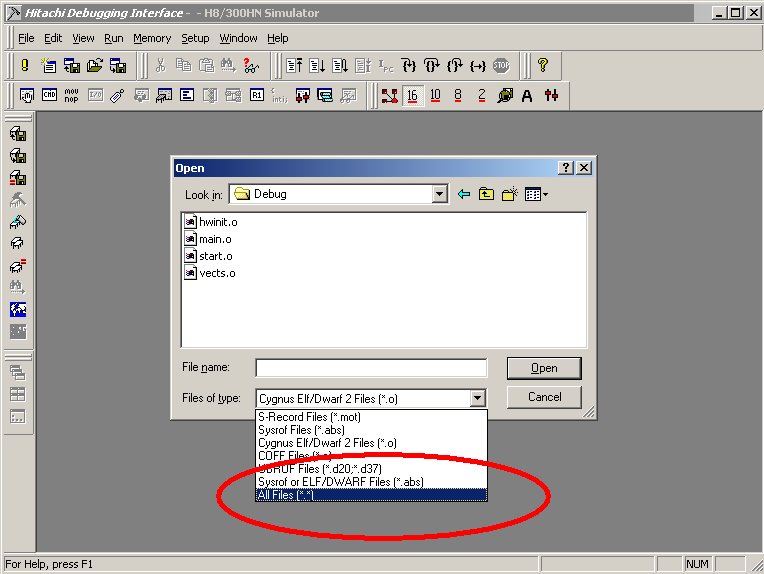
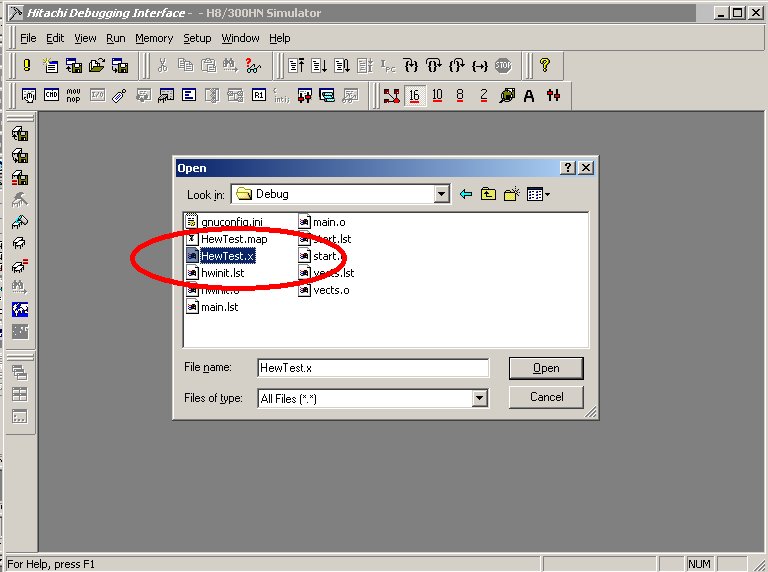
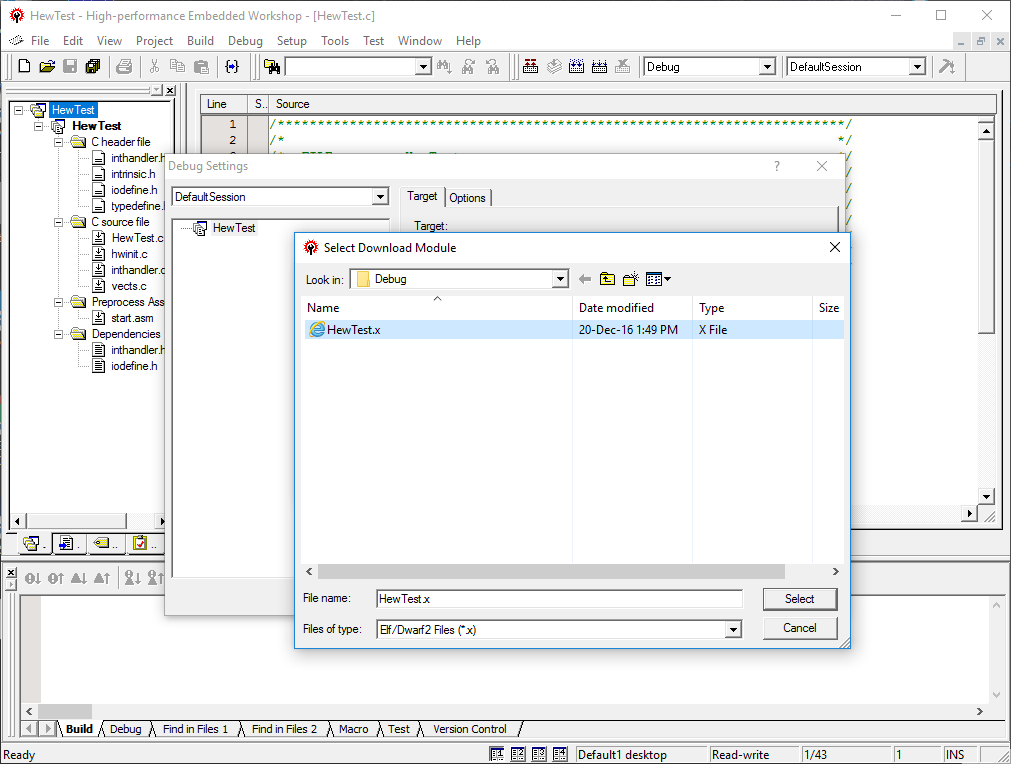
Click the “Browse” button on the “Download Module” dialog box and a file selection dialog box will appear. Usually it opens in the project Debug folder. If not use this to navigate to the “D:\HewTest\Debug\” folder. In this folder, select the file “HewTest.x” and then click the “Open” button to confirm the selection.
HEW2 returns you to the “Download Module” dialog box. As before, be sure to select the “Elf/Dwarf2 for KPIT” option as any other selection, including “Elf/Dwarf2” is incorrect and may cause HEW2 to become unstable or read the debug information in your project file incorrectly. Ensure that the “Offset” field is at its default value of 00000000 and the “Download debug information only” option is off (again, this is its default value). Now click the “OK” button on the “Download Module” dialog box and then click “OK” on the “Debug Settings” dialog box. HEW2 now loads various debug components and you should notice that a number of new toolbars are added to the user interface.
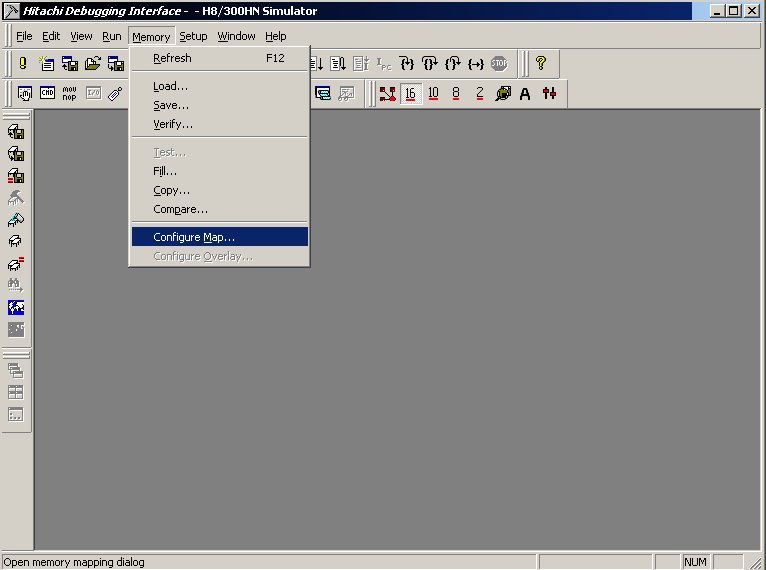
Although the H8/300HN simulator is configured with an address space typical of this device family, it is necessary to specify exactly what memory exists in our simulated device. To specify this memory, select the “Memory Resource” button from the debug menu bar.
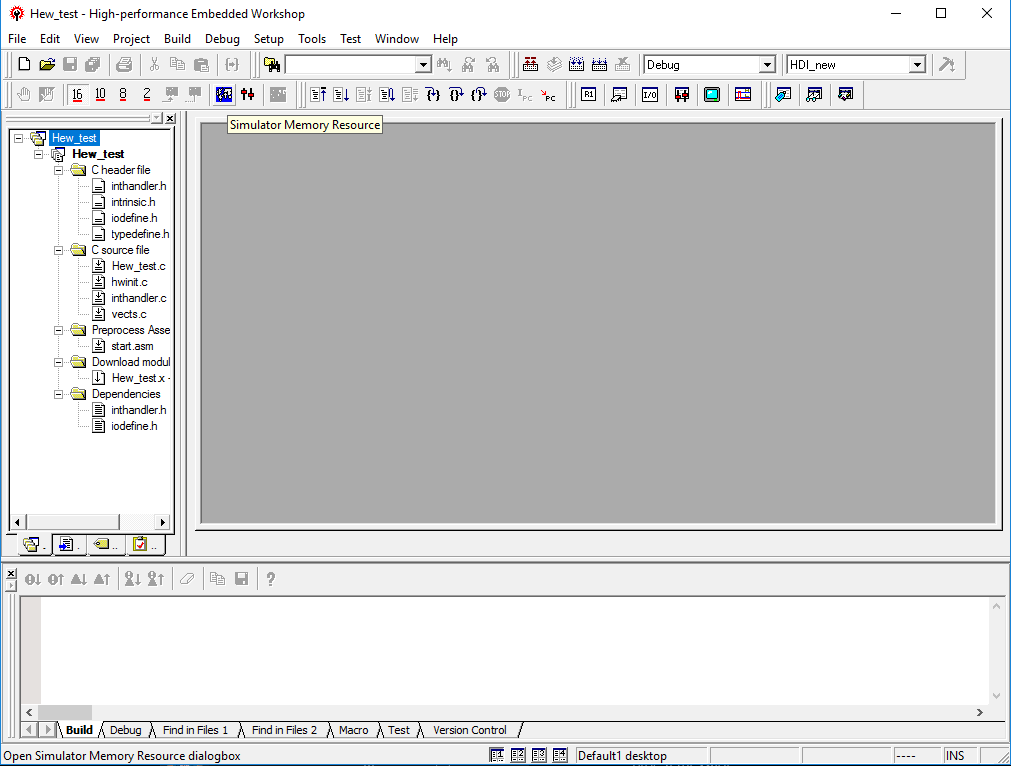
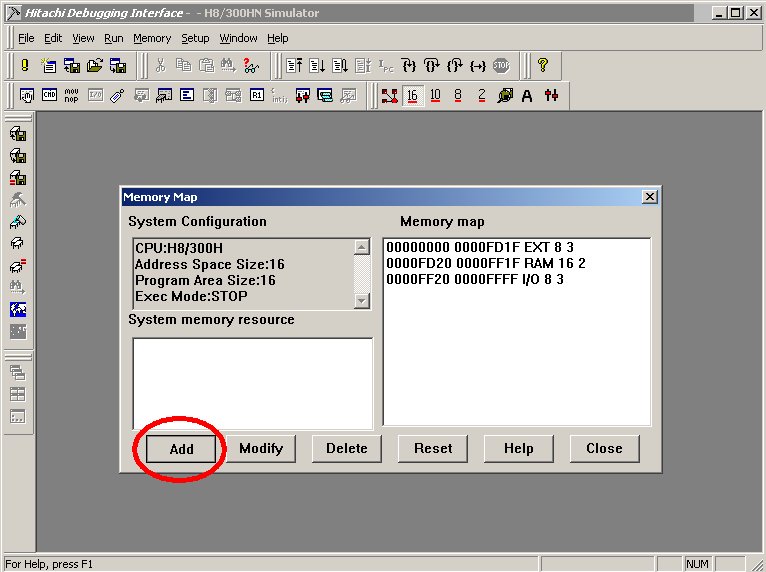
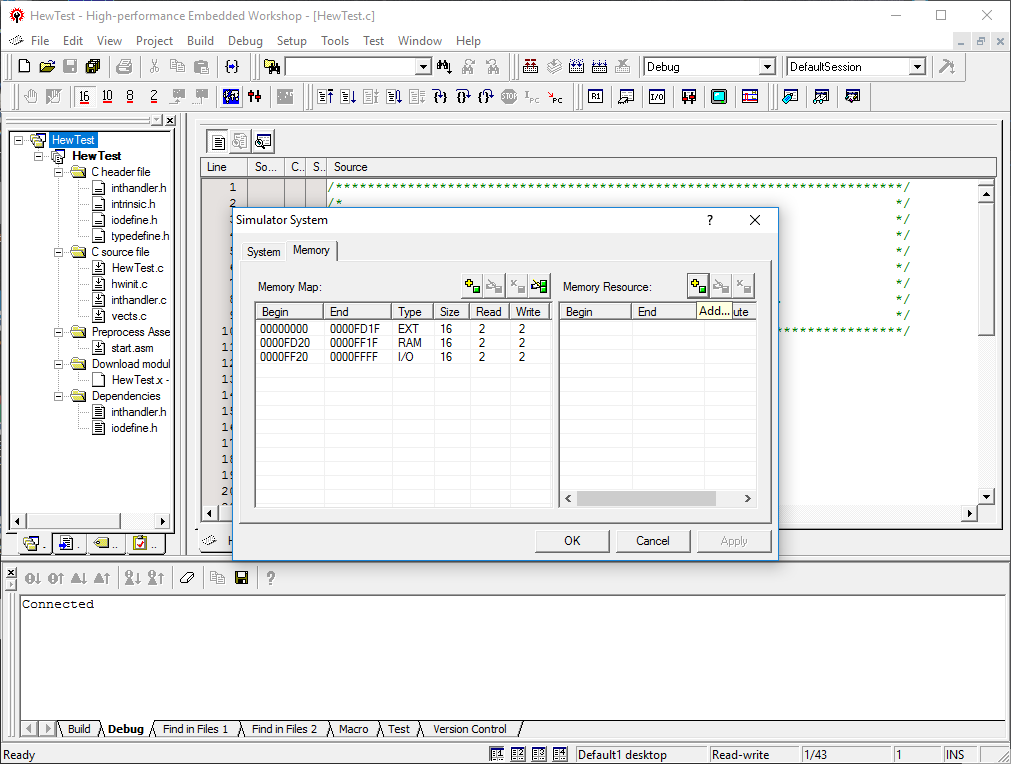
HEW2 now presents a “Simulator Memory Resource” dialog box. Click on the “Add” button right to the Memory Resource as we will be adding a memory area to the simulated target.
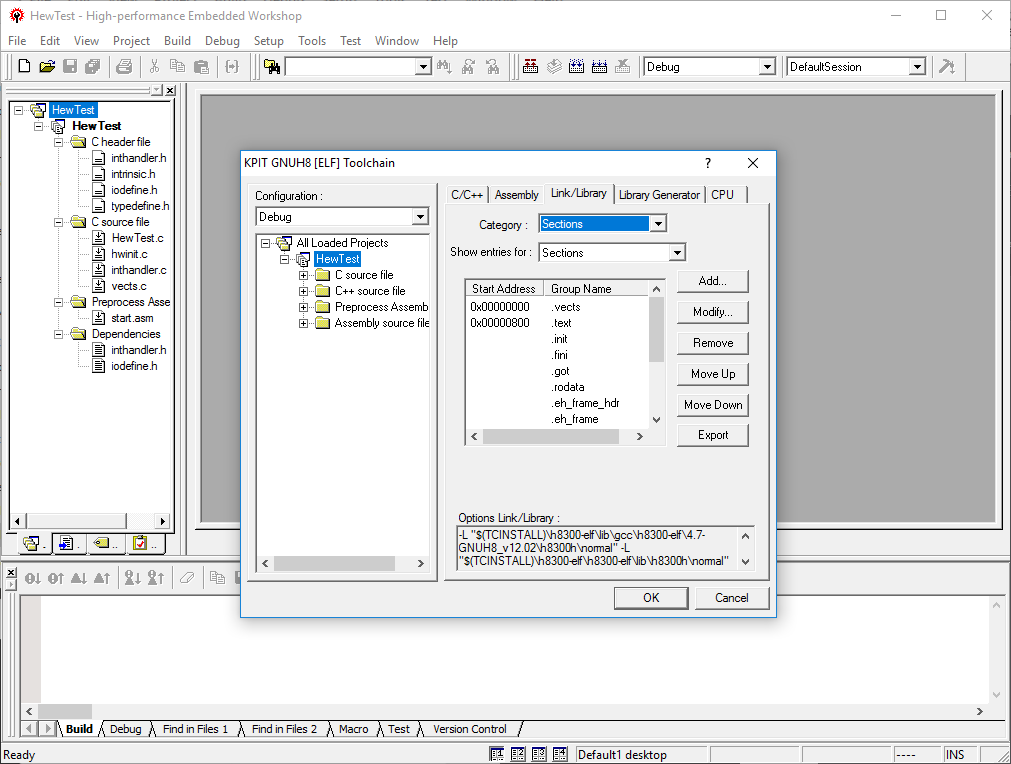
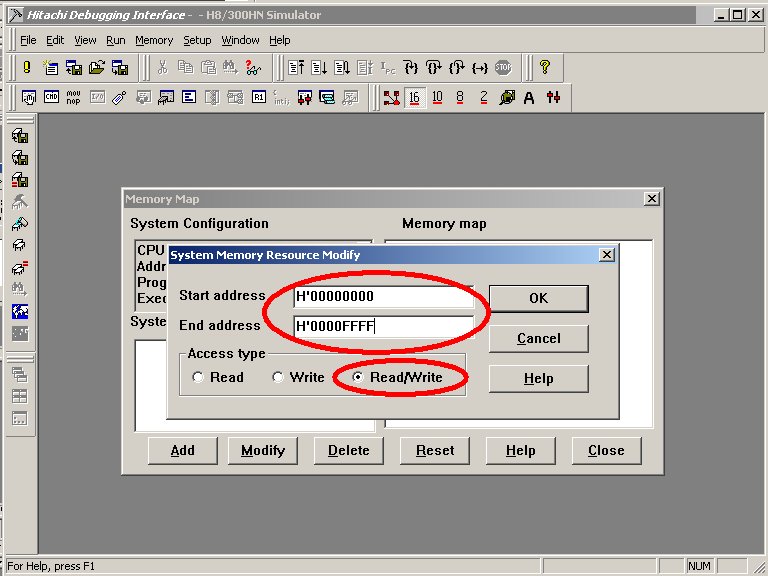
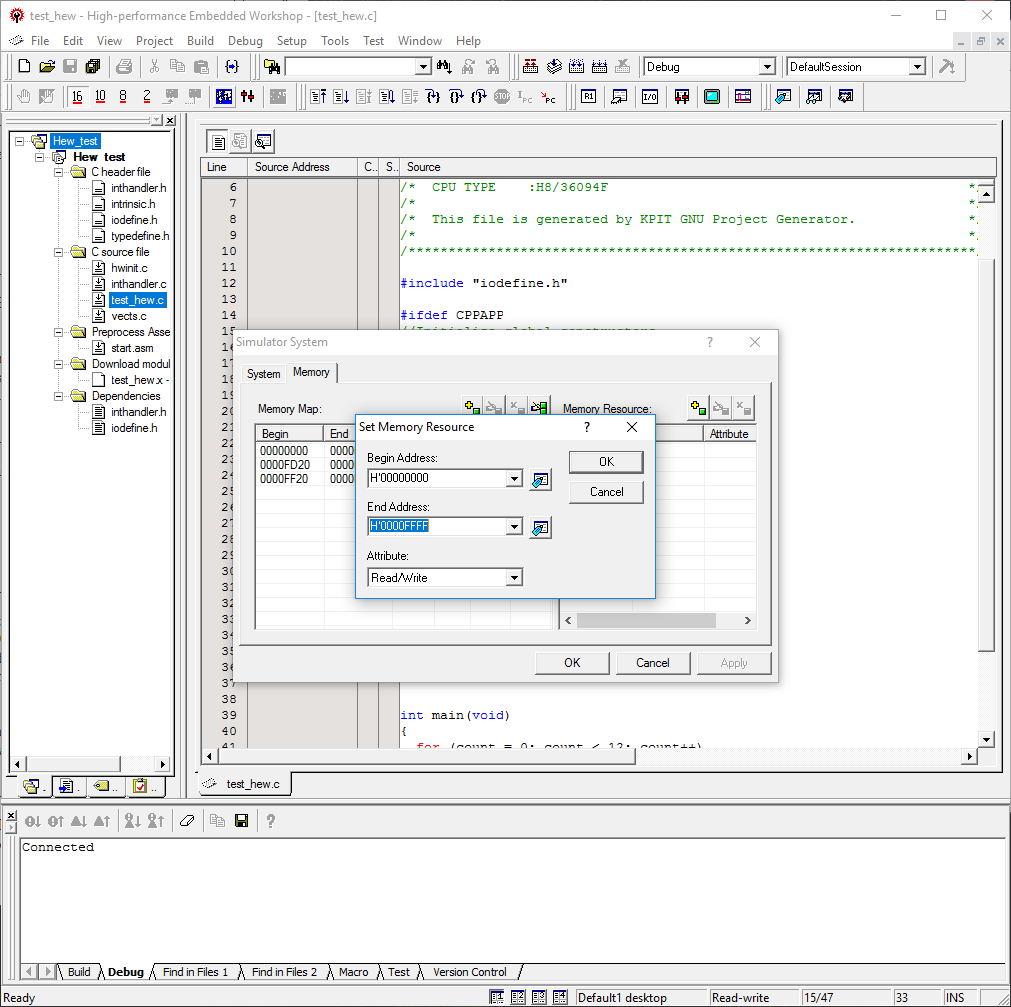
In the “System Memory Resource Modify” dialog box, set the “Start address” to H'00000000 and the “End address” to H'0000FFFF. The access type should be set to “Read/Write”. When done, click the “OK” button.
[Note: This will allocate the entire 64KB address space as RAM. While this is acceptable for this tutorial, you may wish to specify the various areas of RAM (“Read/Write”) and ROM (“Read”) for your specific target to ensure that the memory consumption of your application running on simulated hardware matches the available resources on your target hardware. For this tutorial, however, it is recommended that you allocate the entire address space as RAM as described above.]
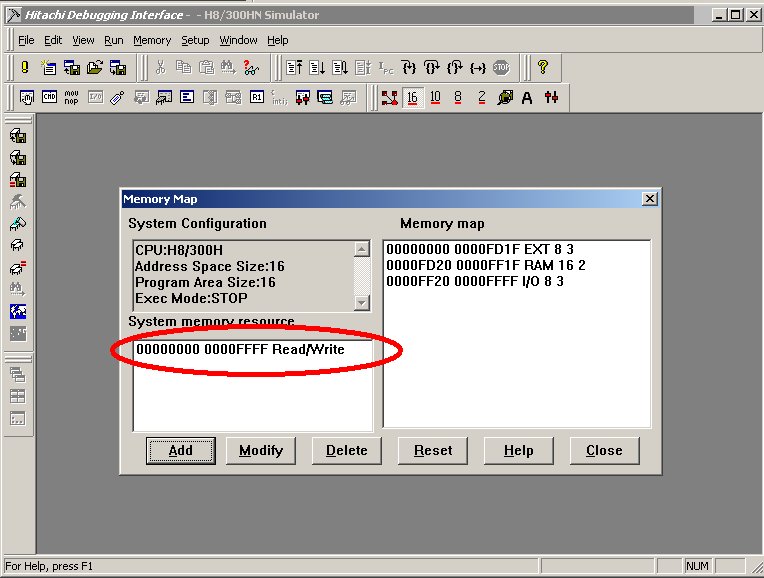
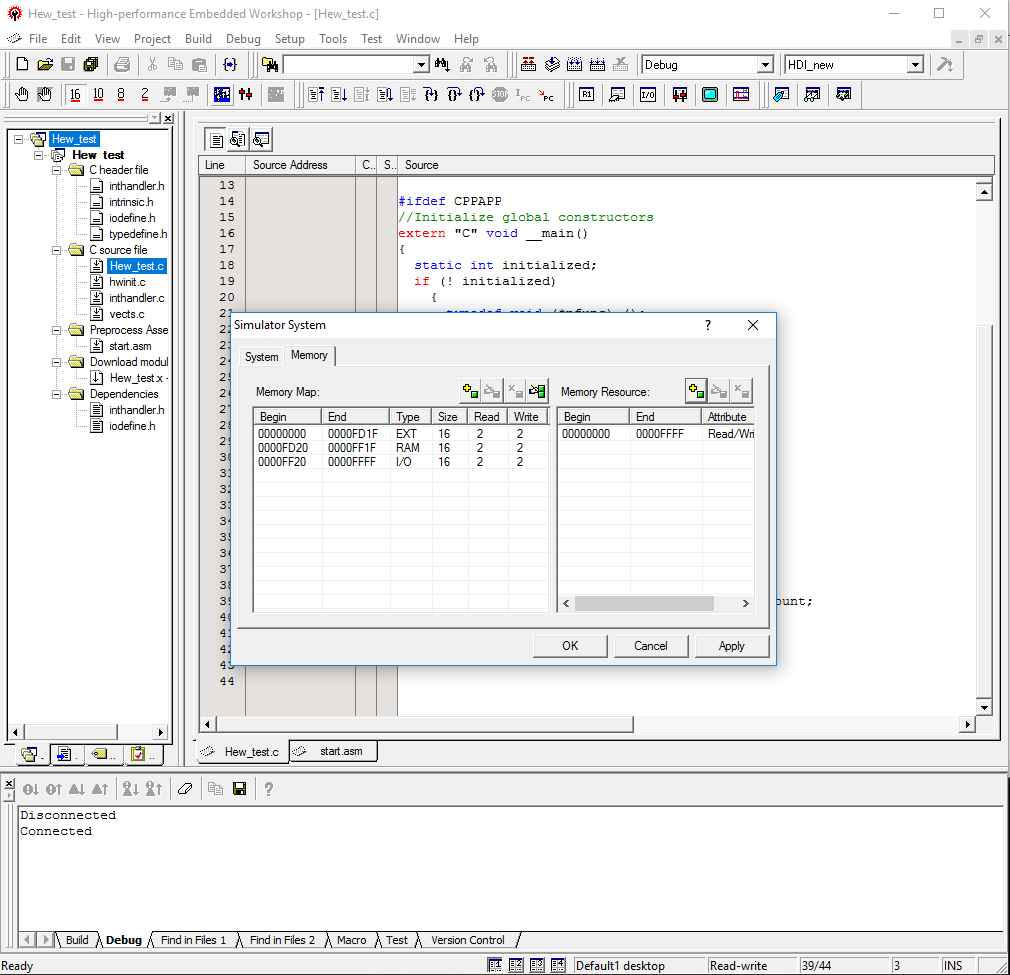
Note that the new memory area (H’0000-H’FFFF) is now shown in the “Simulator Memory Resource” area. To commit your changes click the “Apply” button.
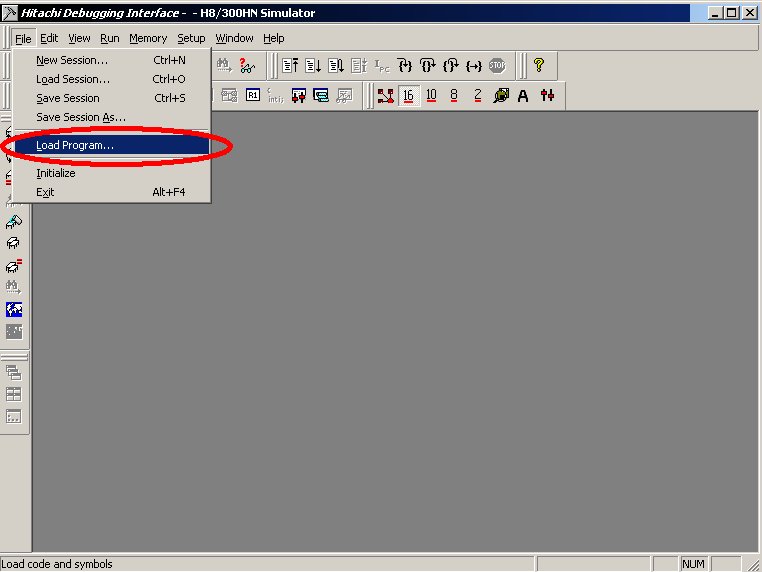
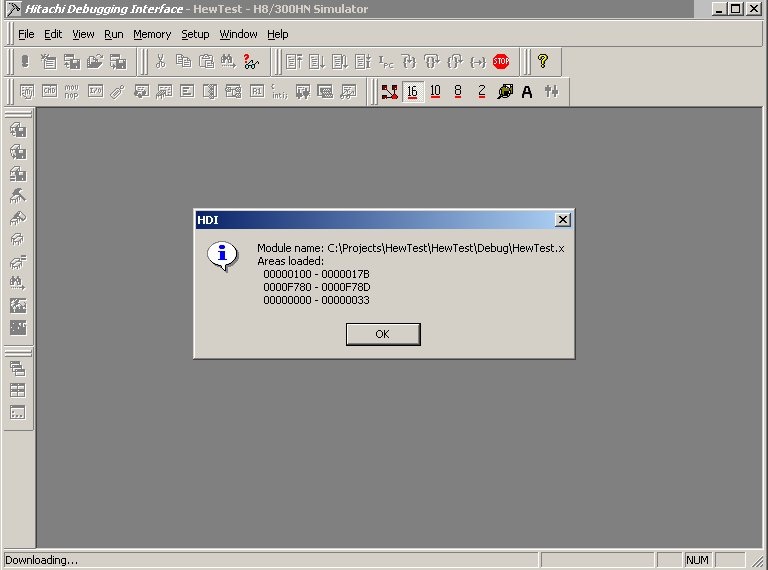
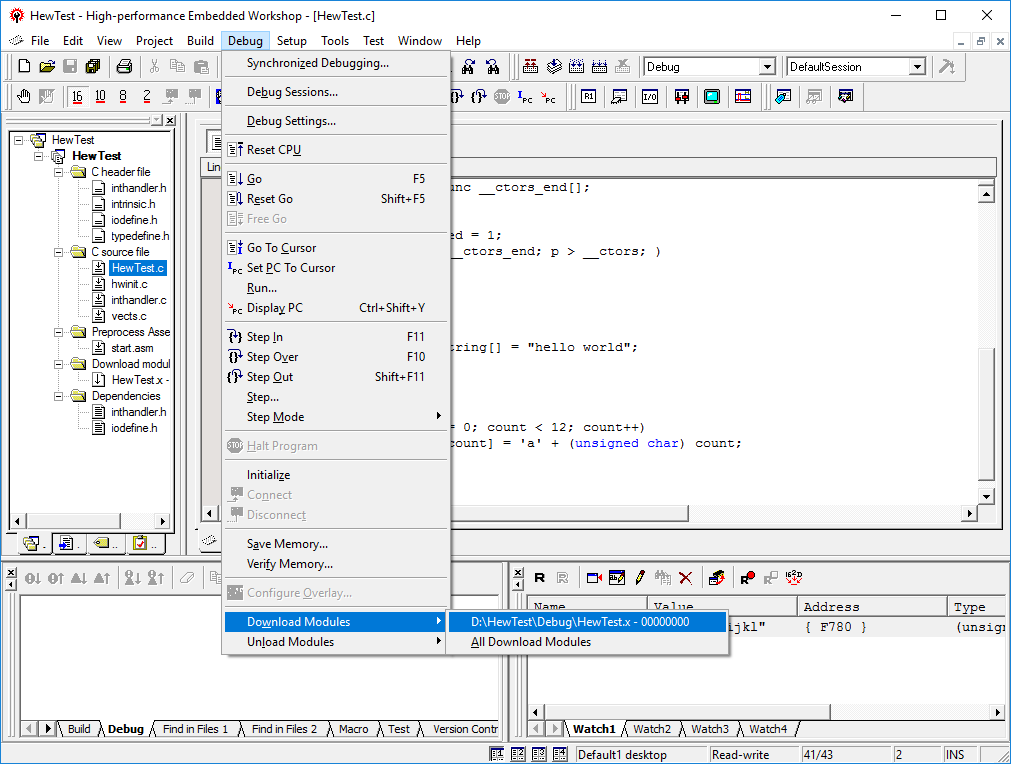
Now we will download our tutorial application into the simulated target’s memory. Select the “Download Modules” item from the “Debug” menu on the menu bar. In the sub-menu that is displayed, select the option “D:\HewTest\Debug\HewTest.x - H'00000000”. HEW2 will now download the tutorial program into the simulator’s memory. This includes both ROM and RAM sections; both code and data. If any error relating to invalid addresses appears at this stage, be sure you configured the memory map correctly in the earlier stages. If no messages are reported, the download was successful.
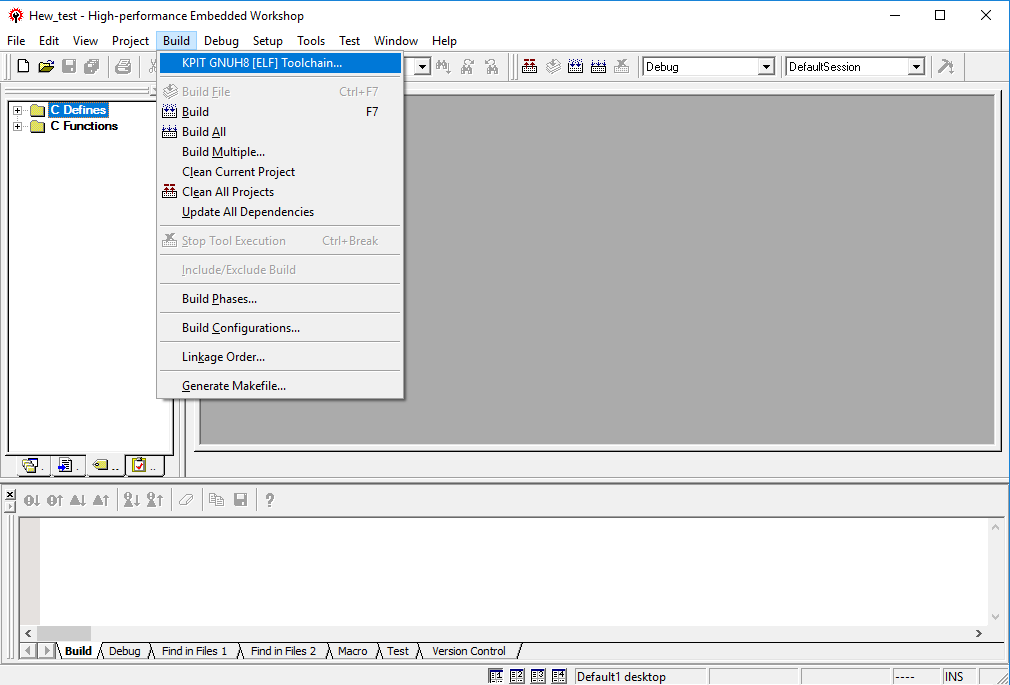
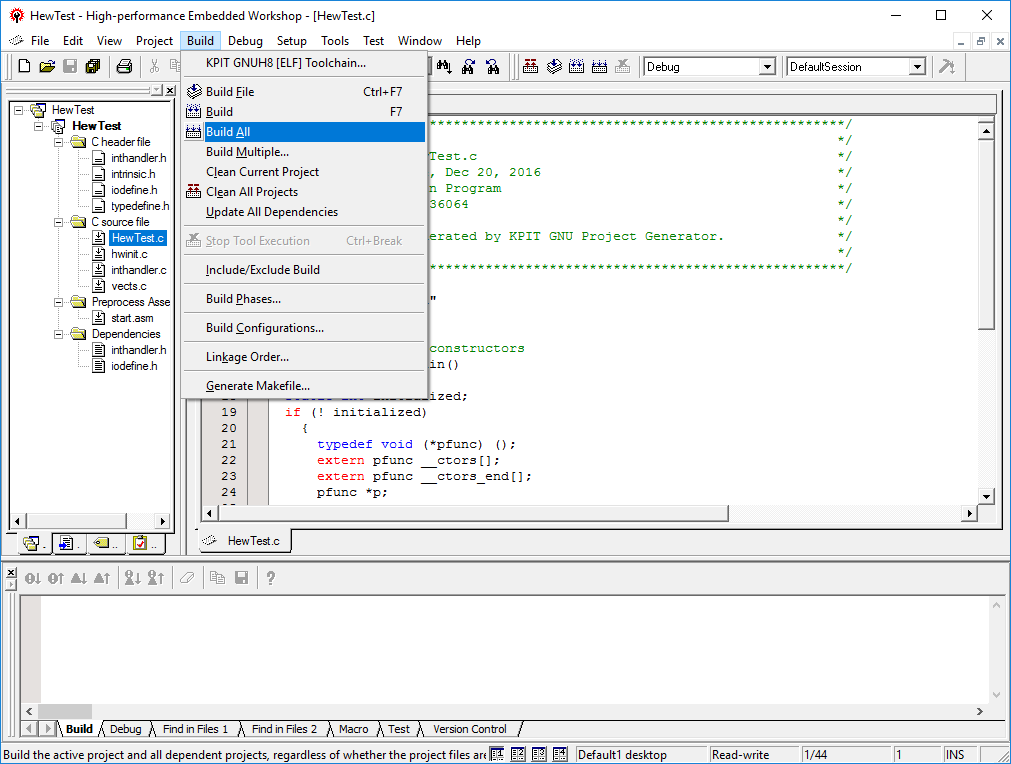
[Note: In HEW2 there are a number of ways to download the tutorial application. Selecting “Rebuild All” item from the “Build” menu on the menu bar will give you the option of downloading the created module. Alternatively, right clicking the “HewTest.x” entry in the project files view will display a context menu from which “Download module” can be selected.]
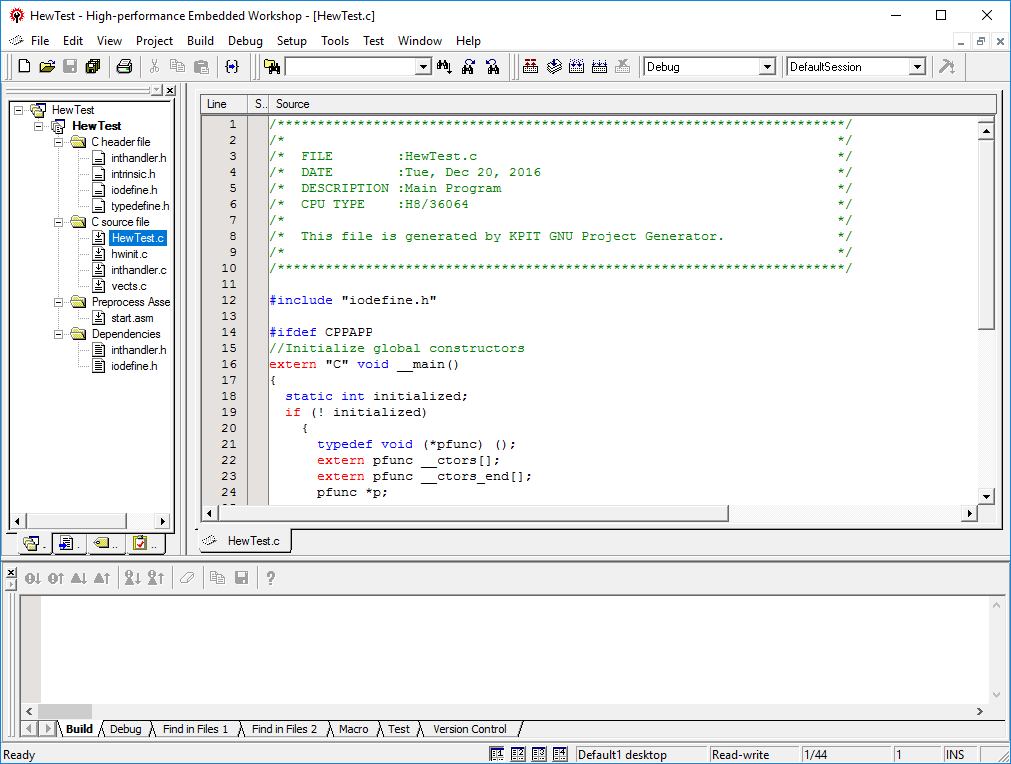
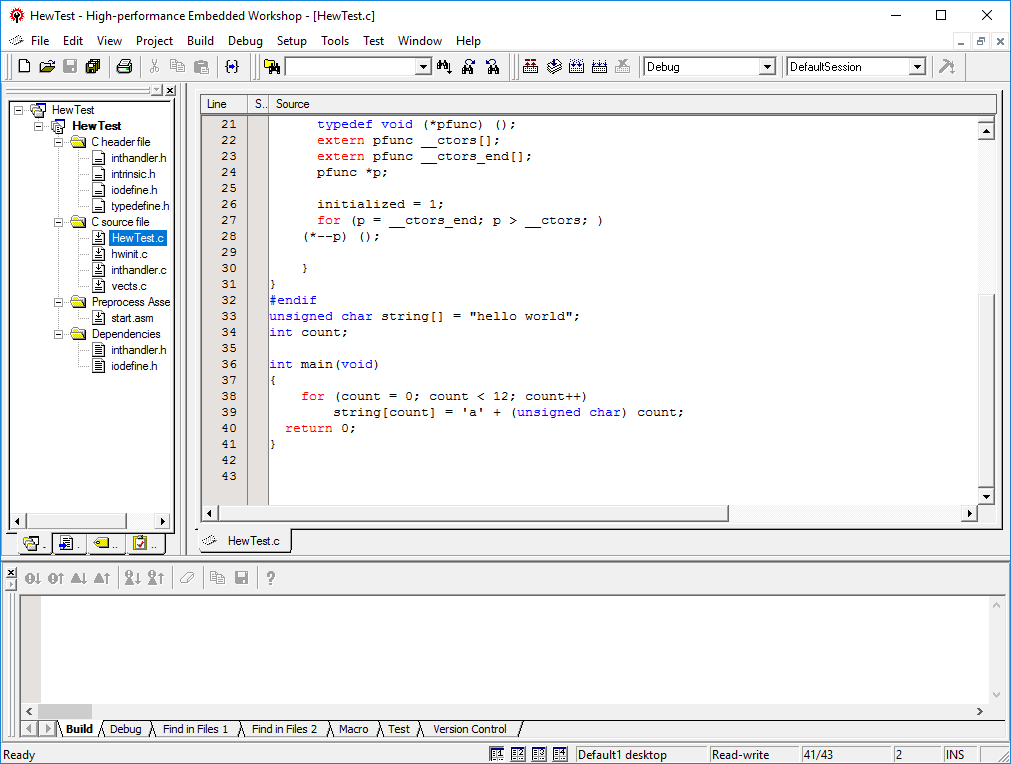
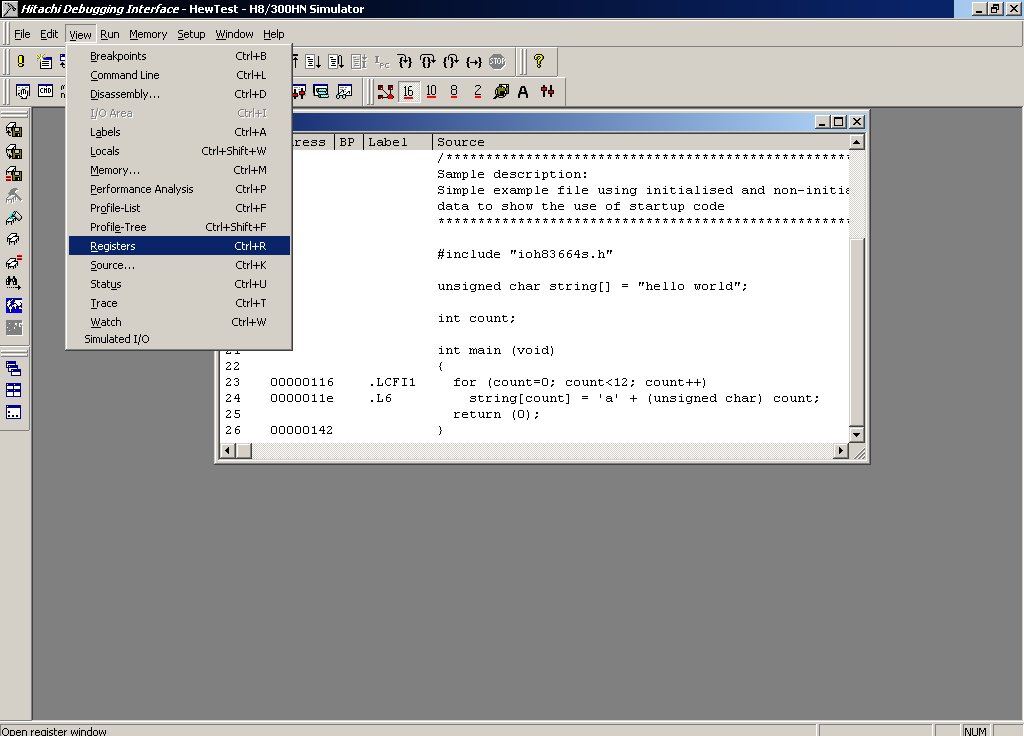
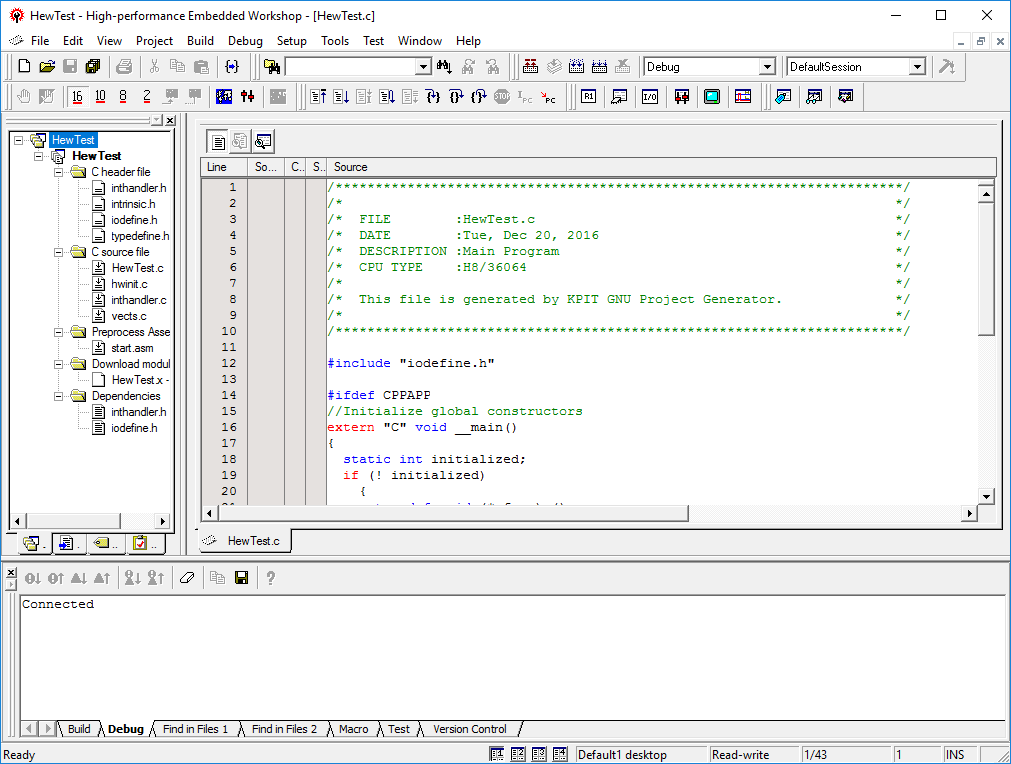
Now our tutorial program is loaded into the target’s memory and the associated debugging information has been loaded into the HEW2 debugger, we can debug the application at the source code level. To do this, we must firstly display one of the application source files. Double click the file “Hew Test.c” in the “Projects” tab. By default this is located on the left hand side of the HEW2 window.
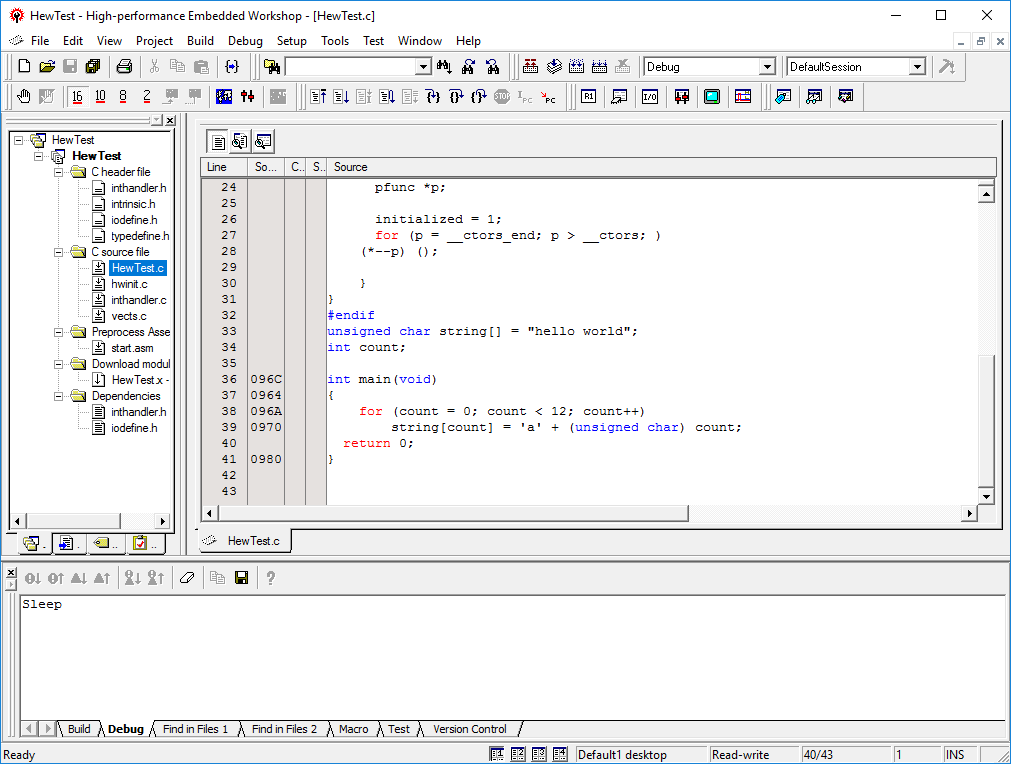
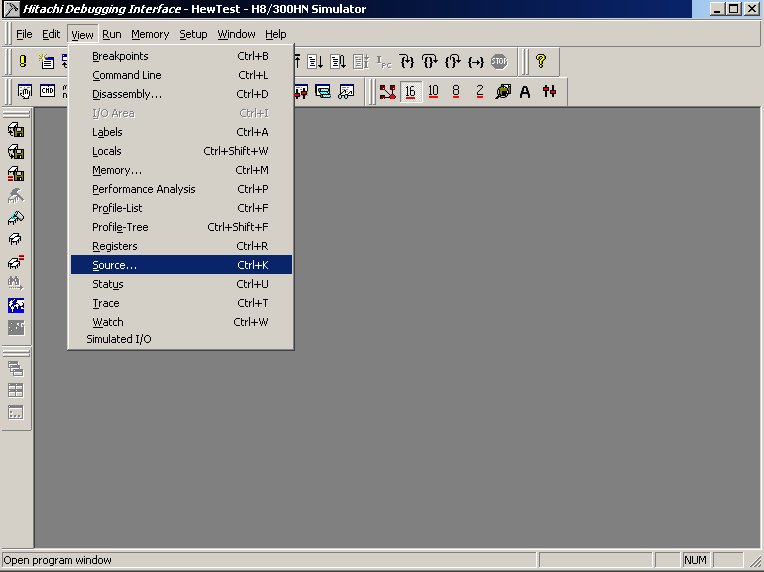
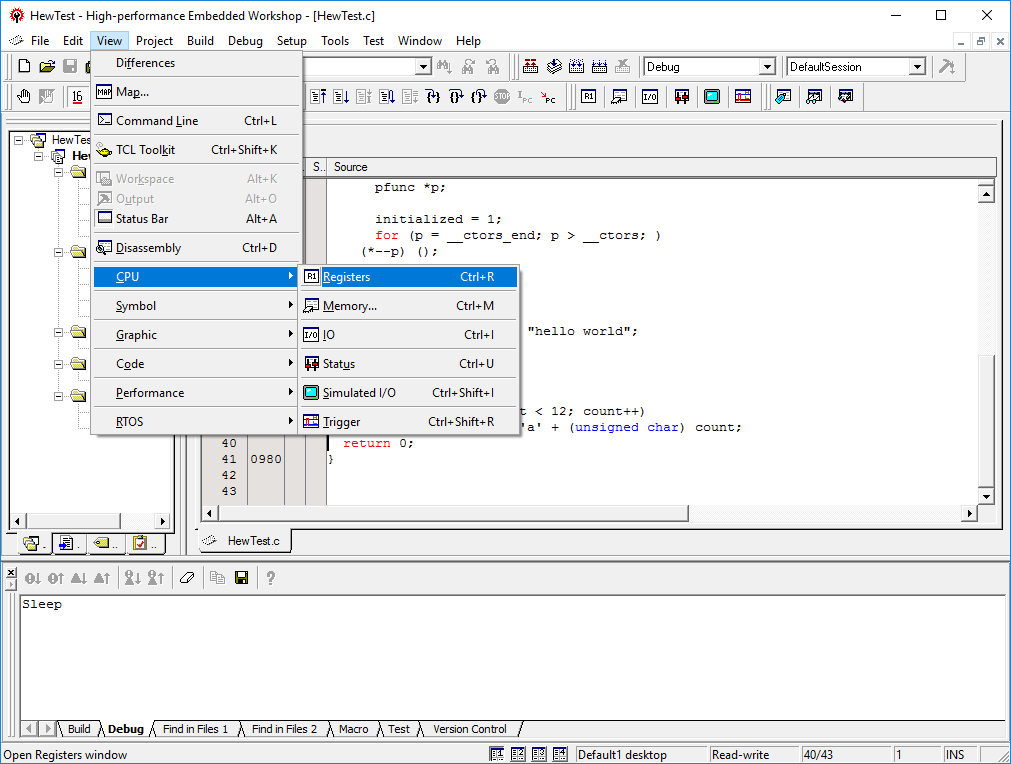
HEW2 now displays the file "Hew Test.c" in the editor window. Notice that assembly labels are displayed against appropriate lines and linked address information is shown against each line of source code. We will now add some extra windows to give us more information about the state of the target device during program execution. Select the “CPU” item from the “View” menu on the menu bar. Now select “Registers” from the sub-menu that is displayed. A frame showing the target’s register values is added to the HEW2 window.
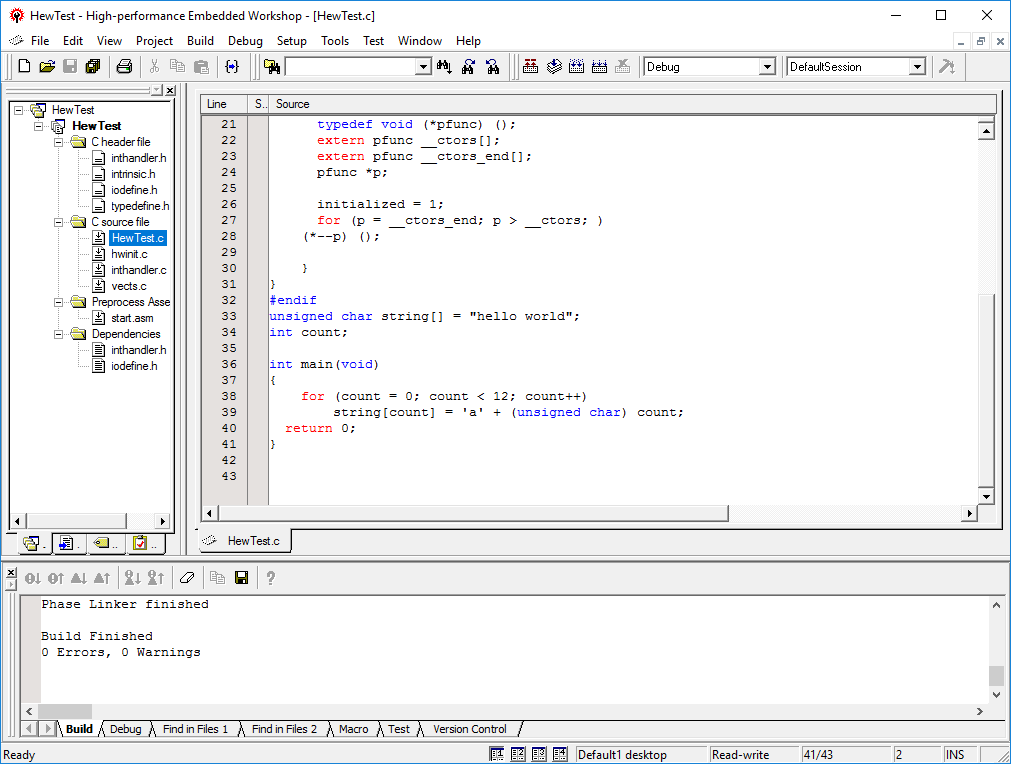
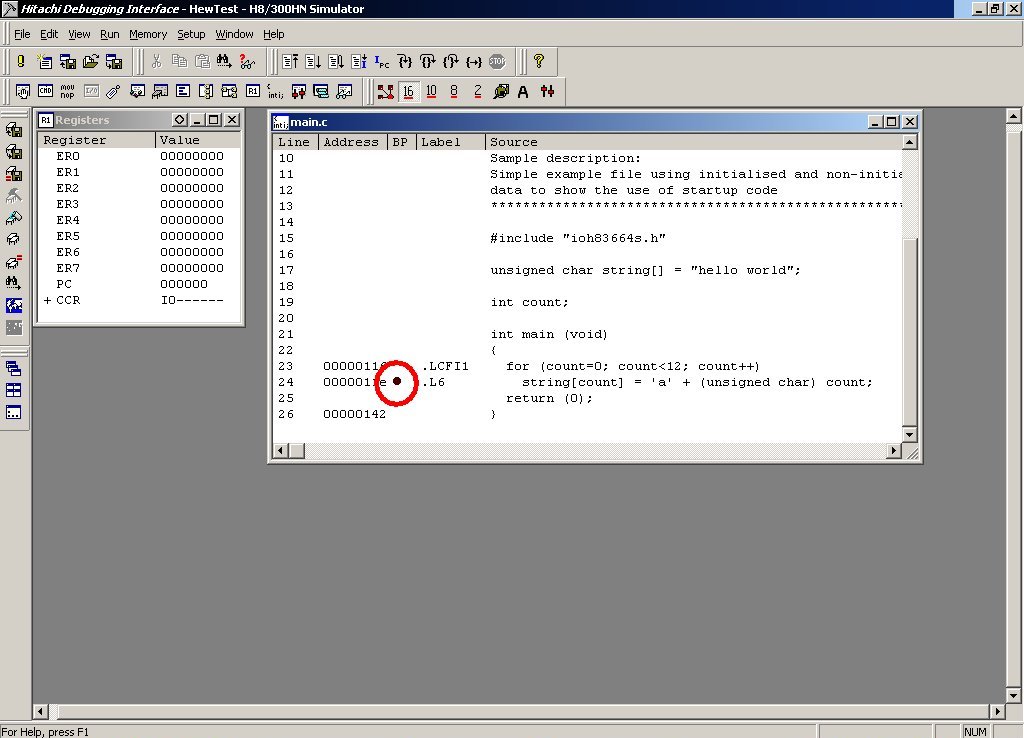
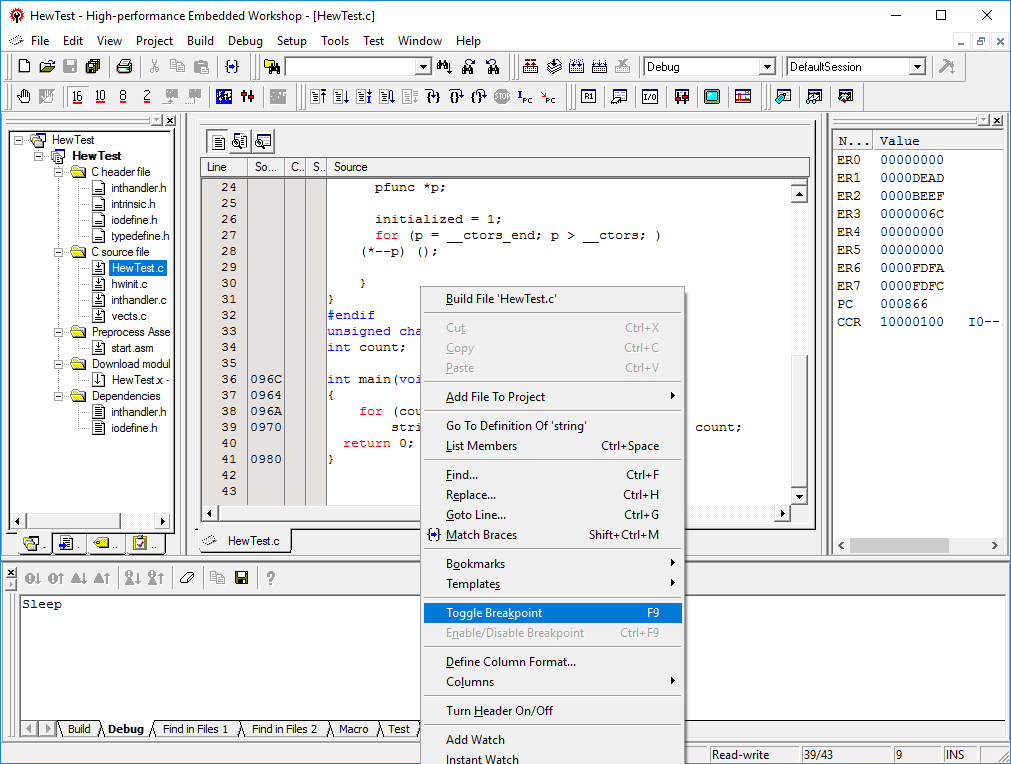
Now we will add a breakpoint to the body of the for(...) loop in the main() function. Position the mouse pointer on source line 39, which starts “string[count]...” (see illustration) and click the right mouse button. In the context menu that appears, select the “Toggle Breakpoint” item.
Observe that a red dot appears in the column closest to the program code on line 42 indicating that the breakpoint has been set.
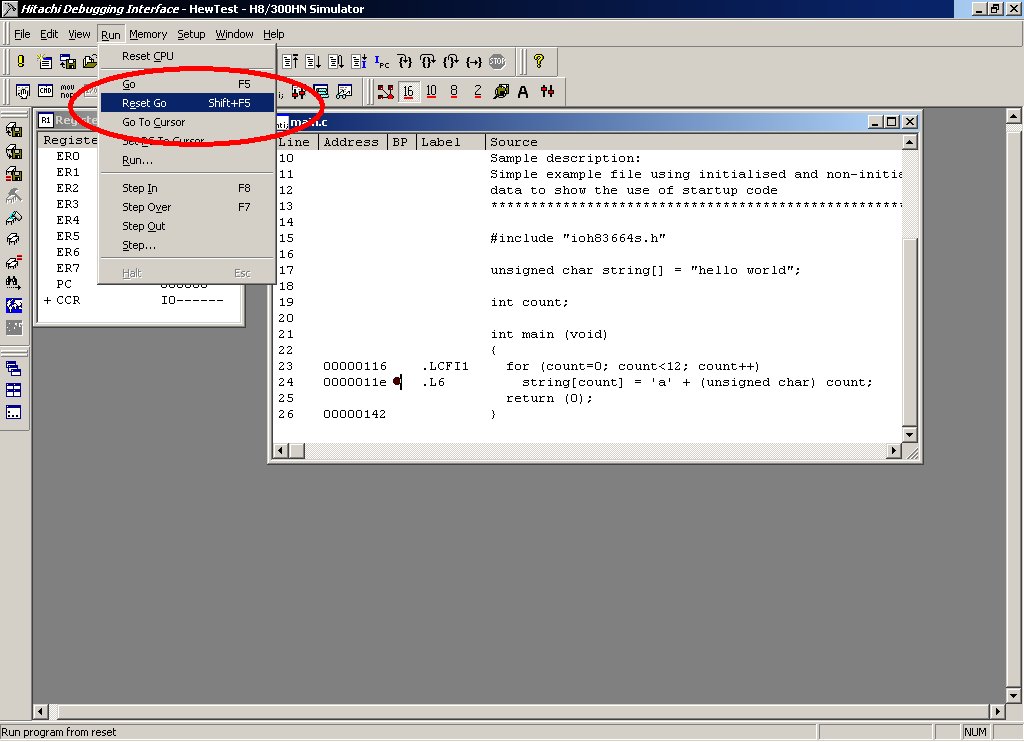
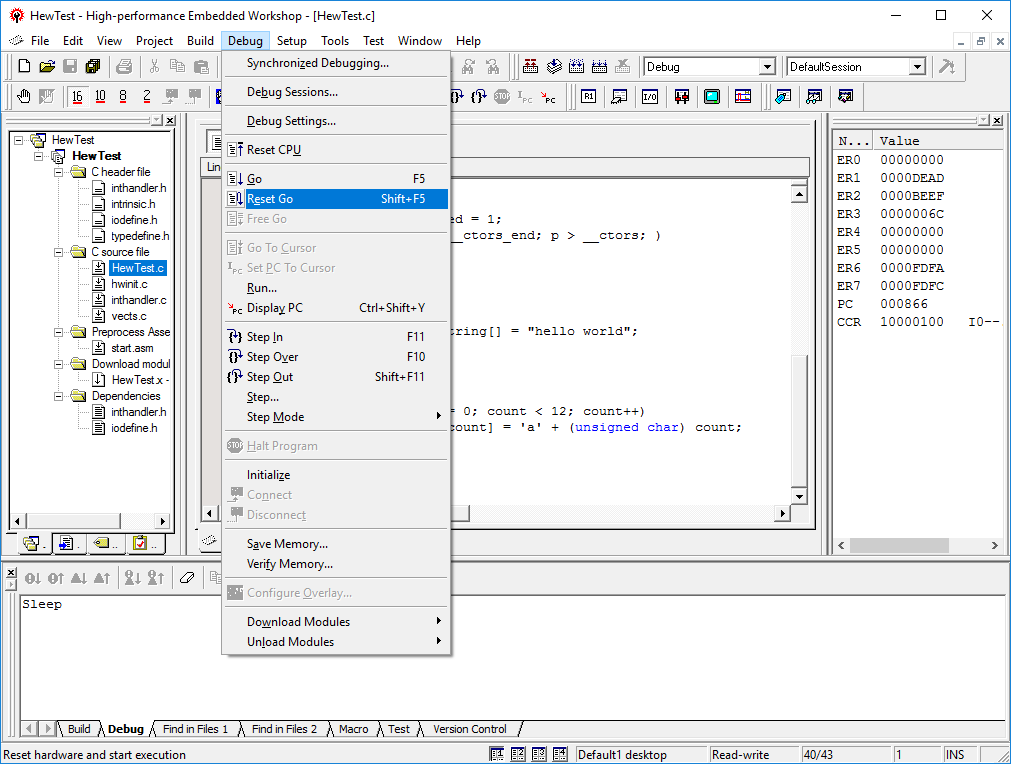
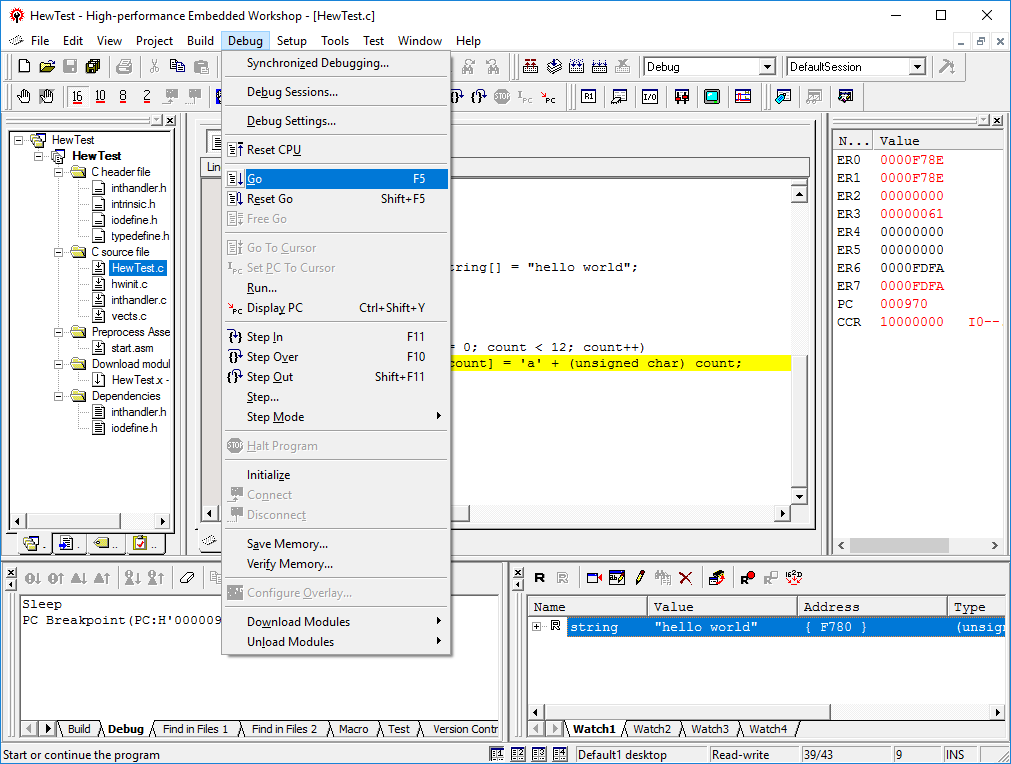
With the breakpoint set, we can start execution. Select the “Reset Go” item from the “Debug” menu on the menu bar. This will reset the CPU and then continue executing the code until the breakpoint.
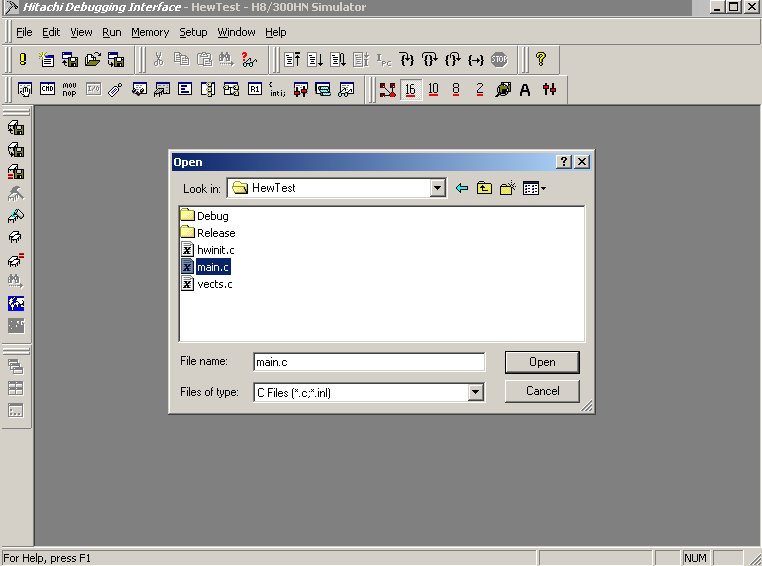
The HEW2 debugger may ask you to locate the source file that contains the breakpoint. This is because the debug information generated by the tool chain indicates the file name but not the entire path to the source code. You should therefore select the file “main.c” from the project directory (“D:\HewTest\”) and click the “Open” button.
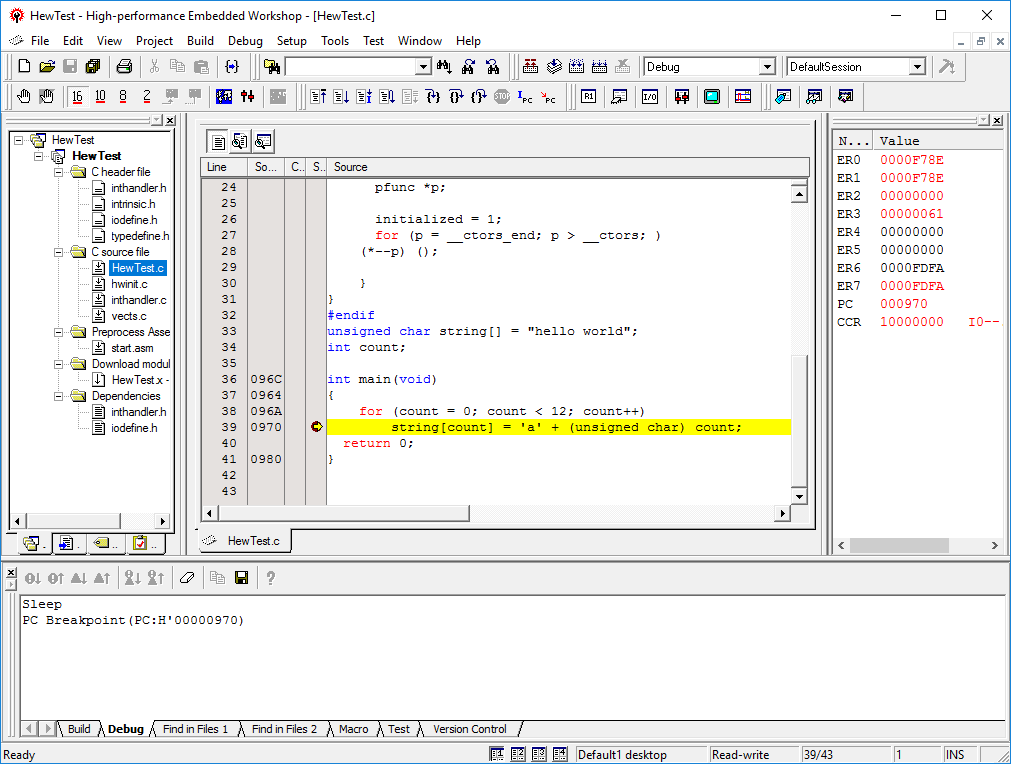
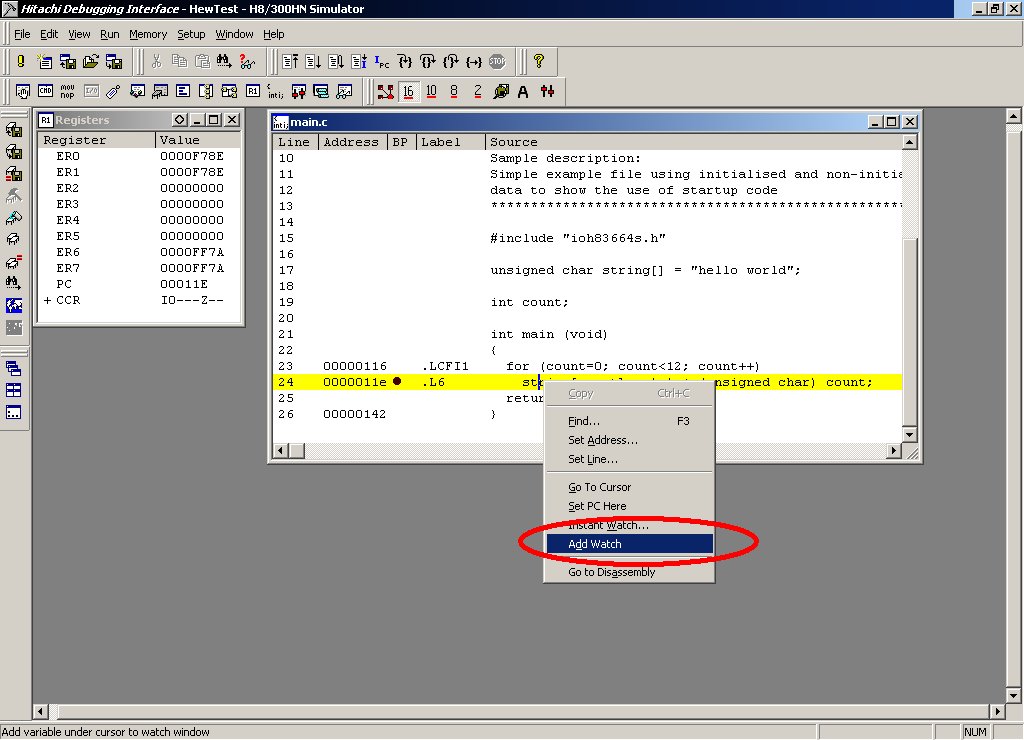
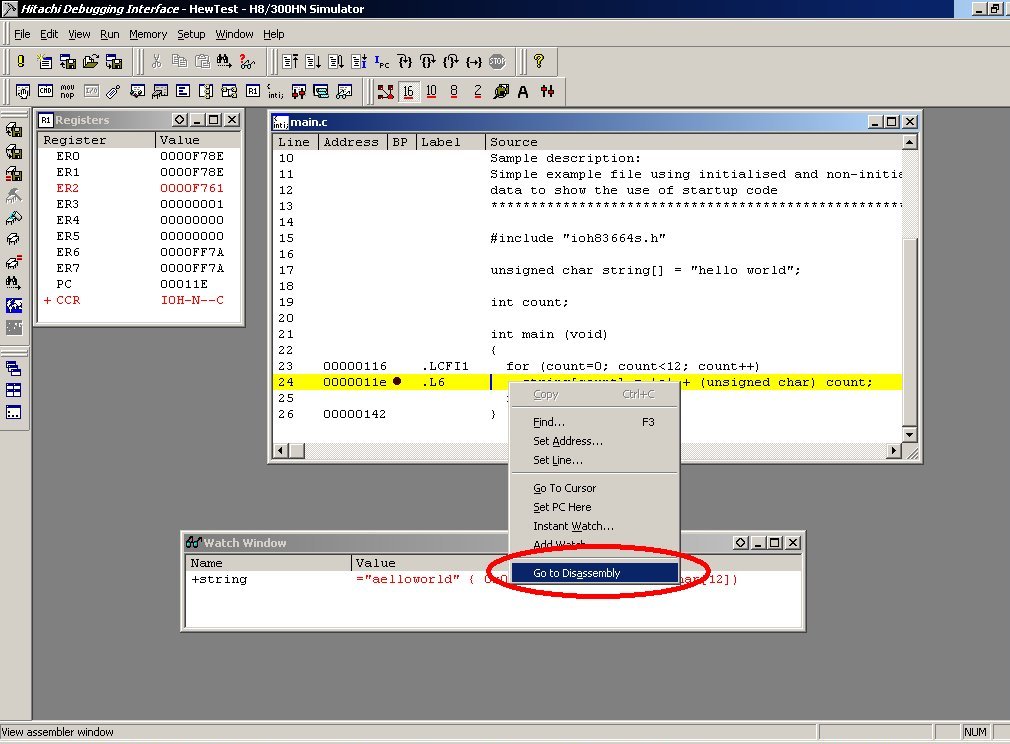
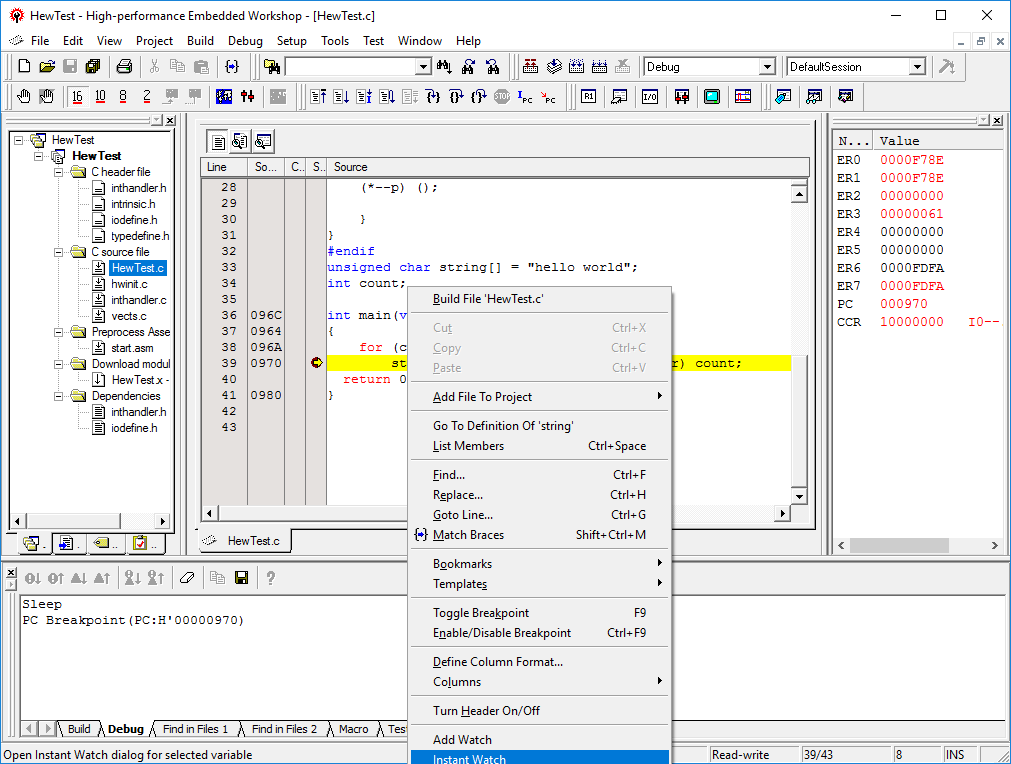
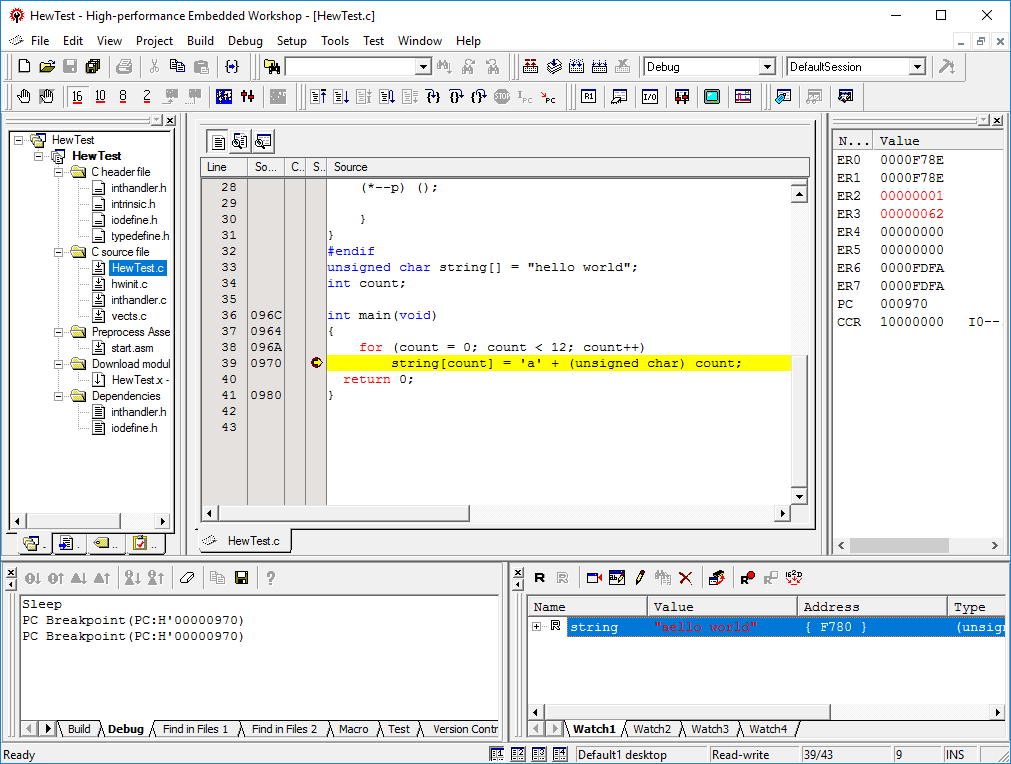
The yellow arrow in the editor window over the red breakpoint dot indicates that the target’s program counter is positioned at an area of program code corresponding to the indicated line of source code and that the breakpoint has interrupted program execution. The simple tutorial program generated by the HEW project generator for GNUH8 simply initialises a string in RAM to “hello world\n” and then changes each letter in turn until the string is changed to “abcdefghijkl”. We will watch the string variable in RAM to see this happen character by character. Position the mouse over the “string” variable on line 39 in the editor window and click the right mouse button to bring up a context menu. From this select “Instant Watch”.
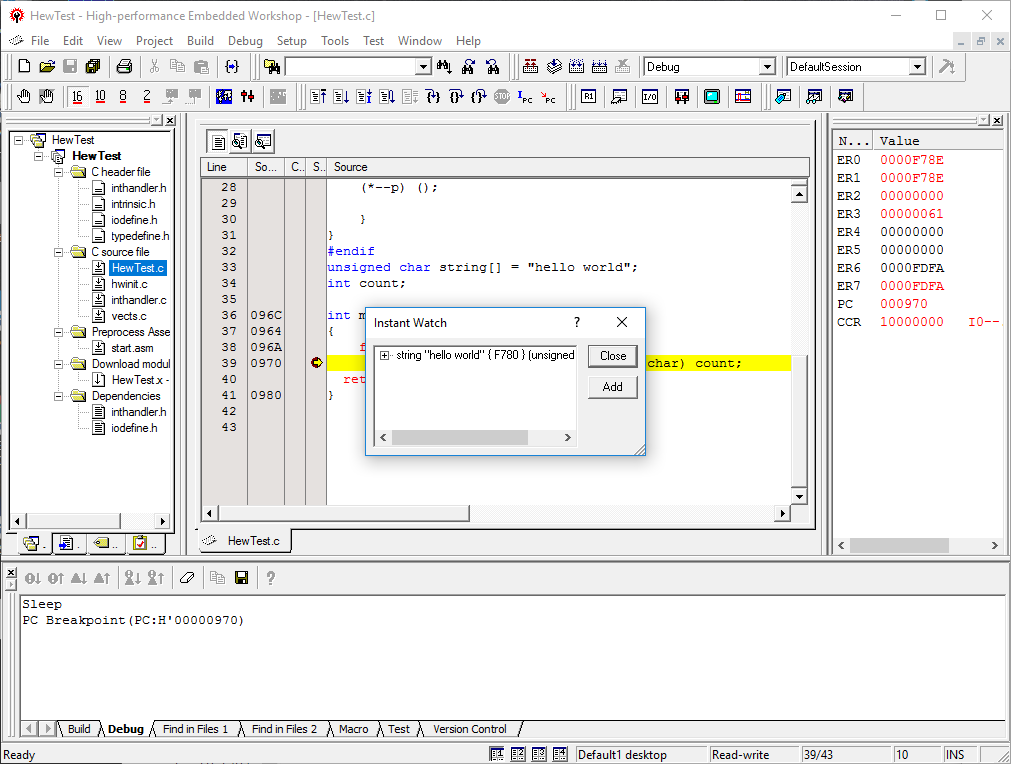
HEW2 displays an “Instant Watch” window containing “string”. Click on the “Add” button.
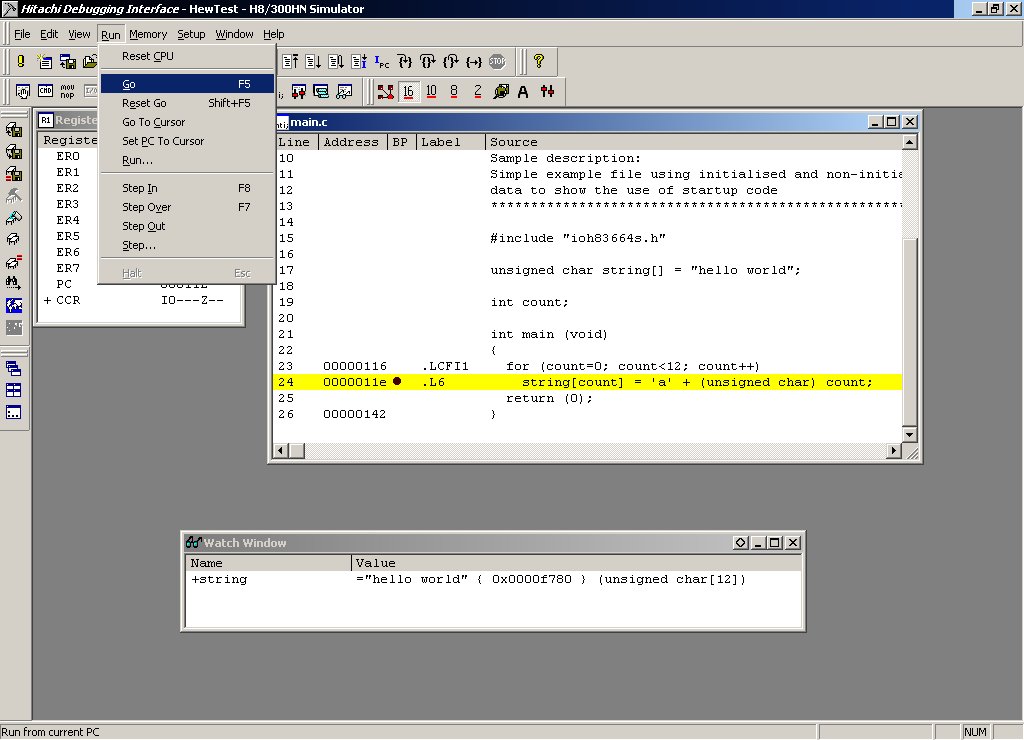
A new “Watch Window” is displayed showing the string variable’s address in RAM, C type and value. At this time you may need to adjust the height and/or position of the various frames in the HEW2 window so you can see the necessary information. Next, select the “Go” item from the “Debug” menu on the menu bar.
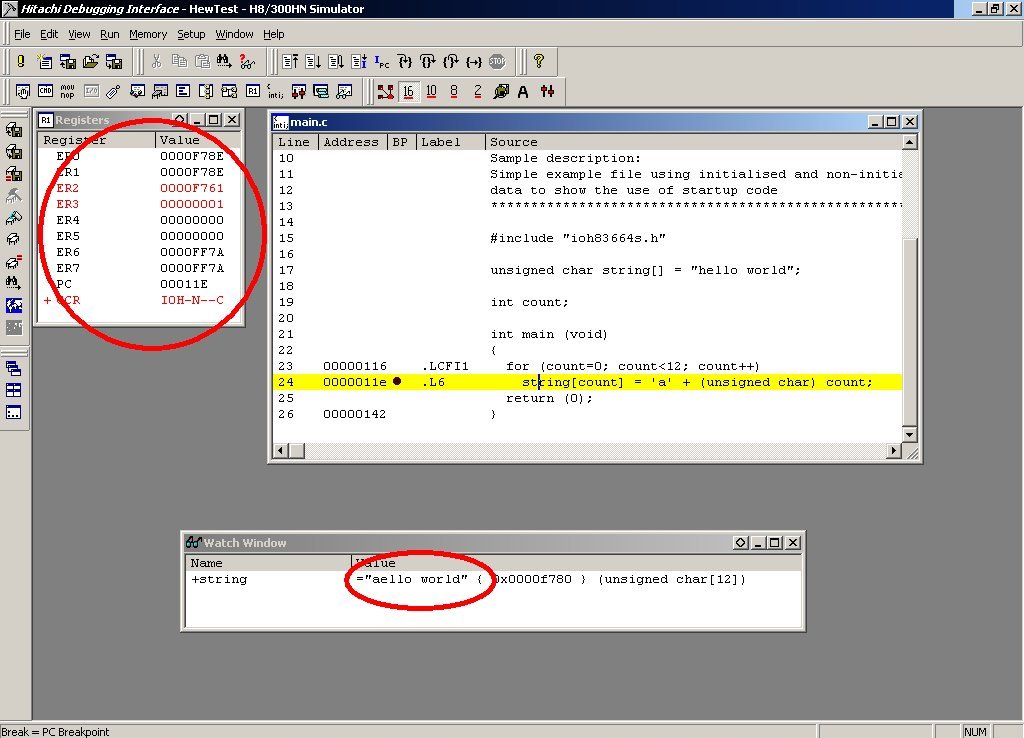
You will see the first character of the “string” variable has changed in the watch window so that string now reads, “aello world\n”. Register values that were modified during code execution are highlighted in red in the “Registers” window.
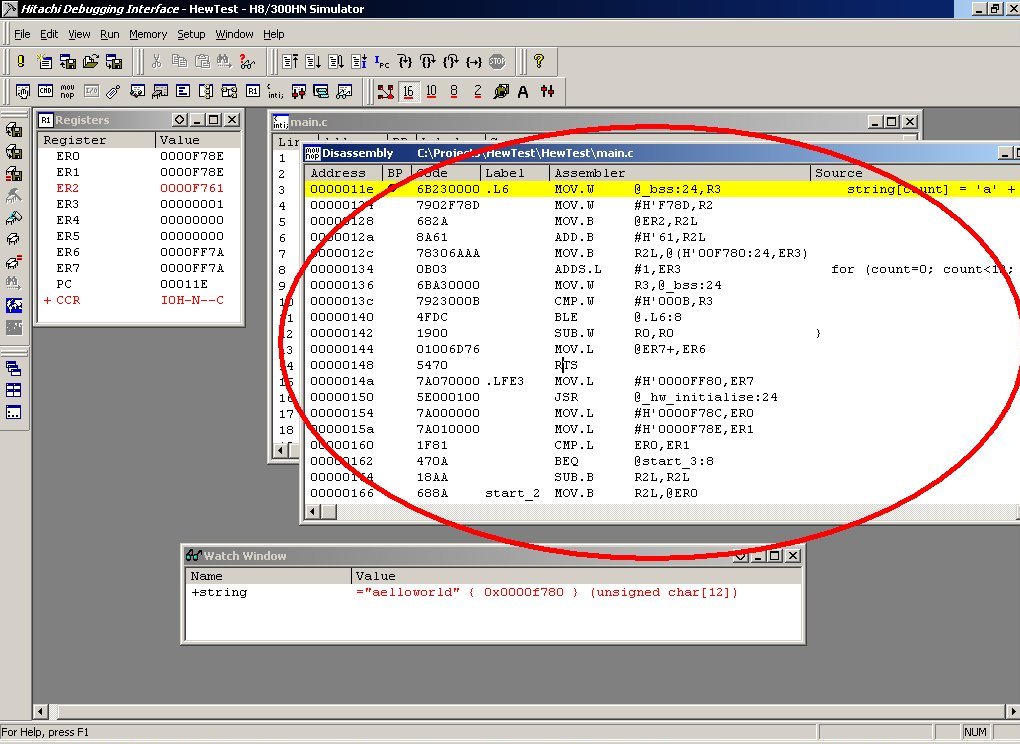
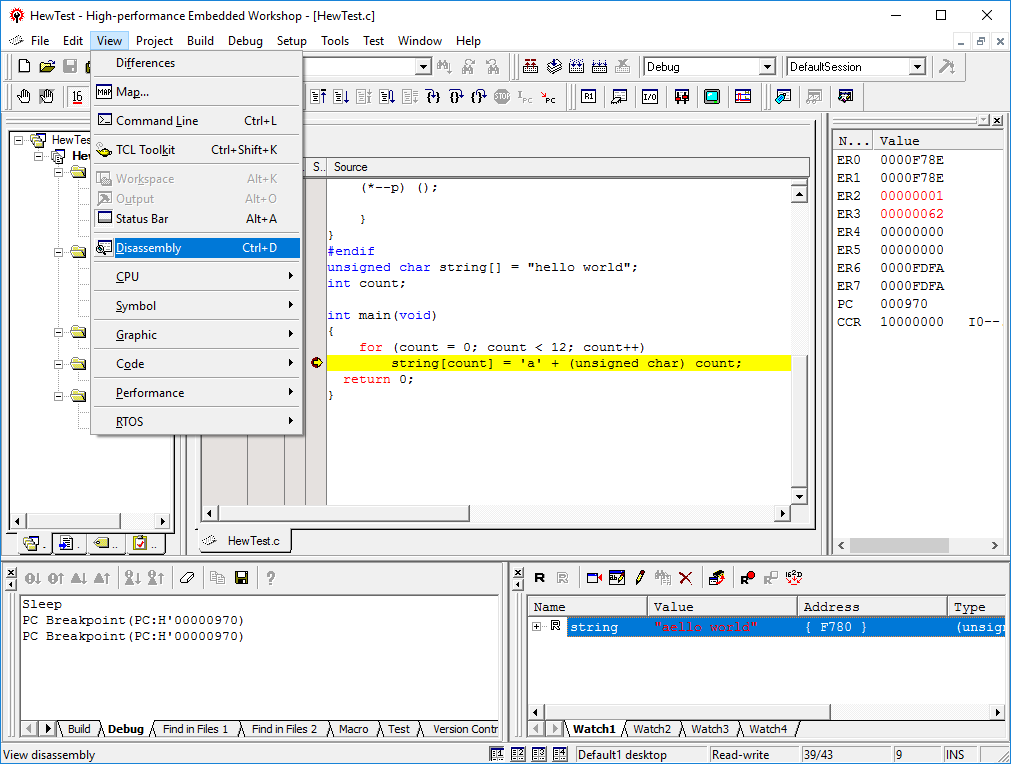
We will now add a further window to our session. This window will display a mixed view of both source code and the generated machine code for that source. This will allow us to see and step through the individual instructions executed on the target. To add this window, click on the "View" tab from the menu bar and select “Disassembly”.
[Note: due to a known bug in early versions of HEW2, you may need to switch back to the main.c source window and then return to the Disassembly window using the Window menu on the menu bar in order for the Disassembly view to appear correctly.
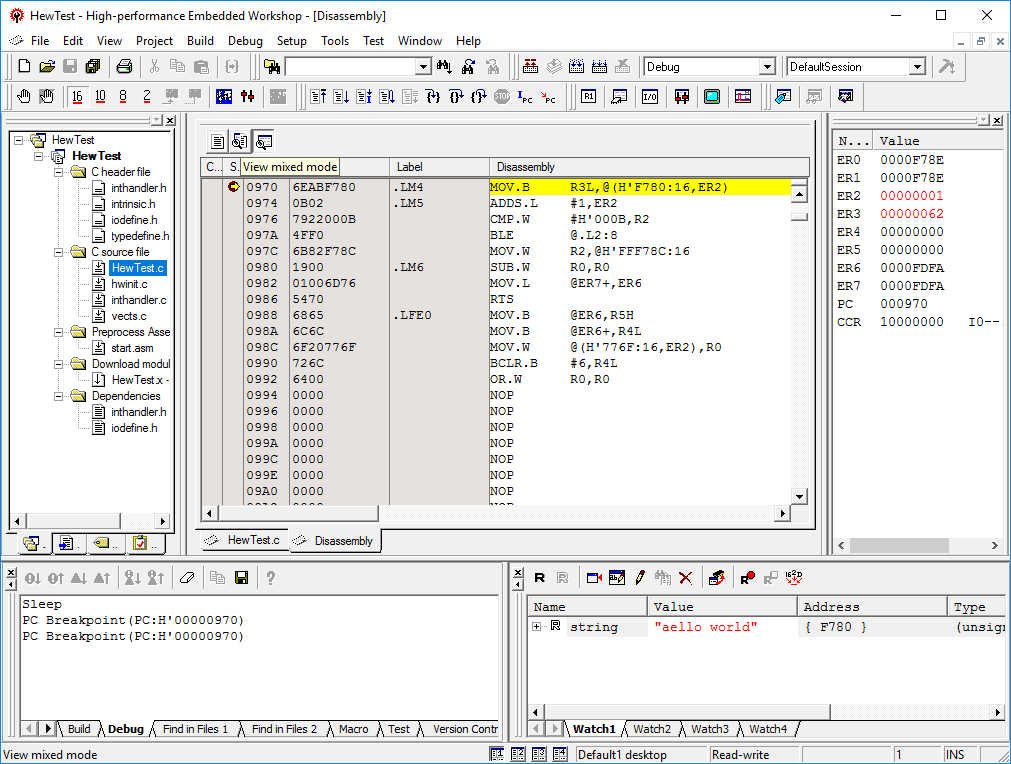
The new “Disassembly” window appears. Note that the yellow arrow overlaid on the red breakpoint dot now shows the individual instruction that will be executed next. In order to view both source and disassembled object code in the disassembly view, click on the second button on top of the dissasembly window. Source code lines are added to the disassembled object code.
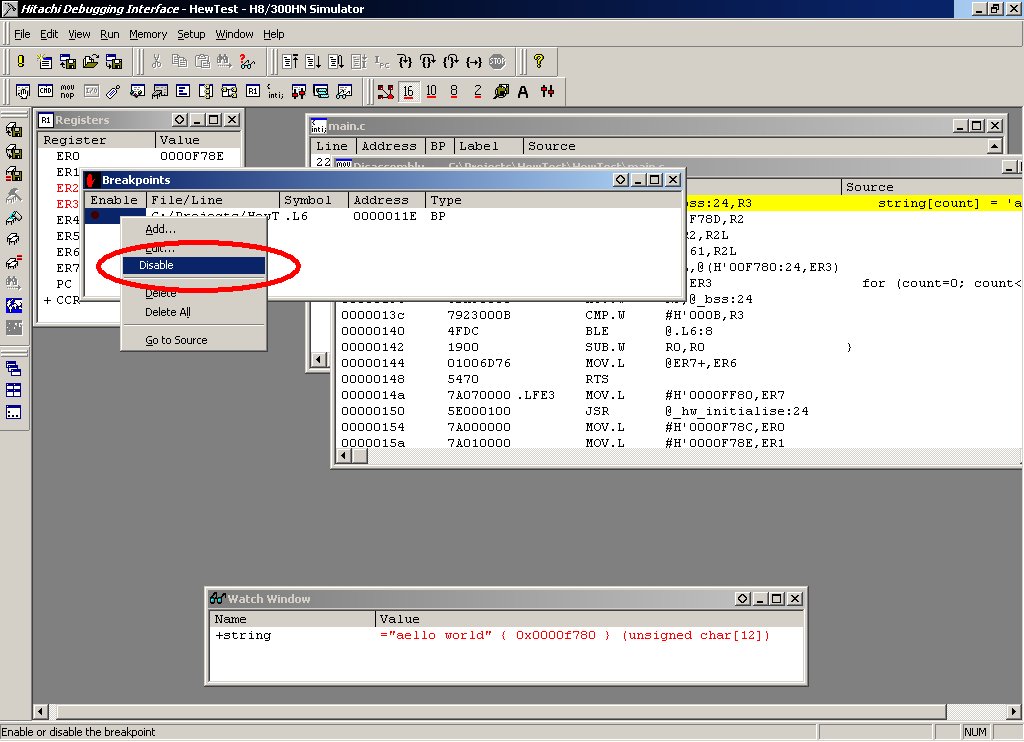
This time we wish to temporarily disable the breakpoint, so position the mouse pointer over the single line in the “Breakpoints” view and click the right mouse button. From the context menu that appears, select the “Disable” item. The breakpoint is now disabled and will not interrupt execution.
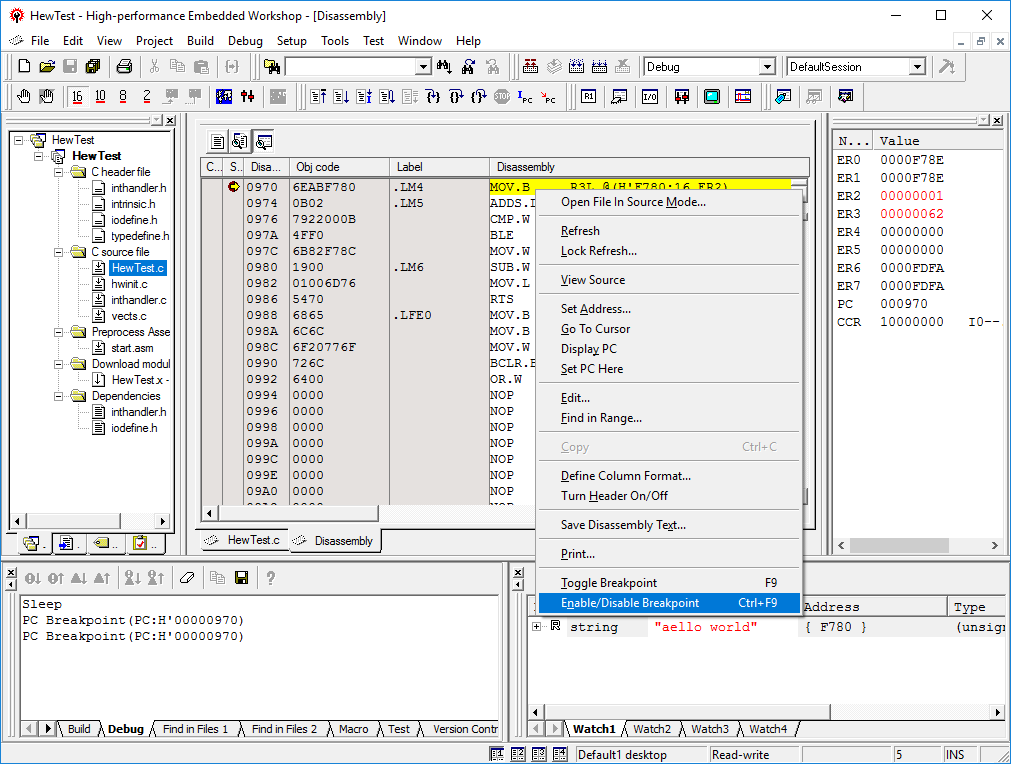
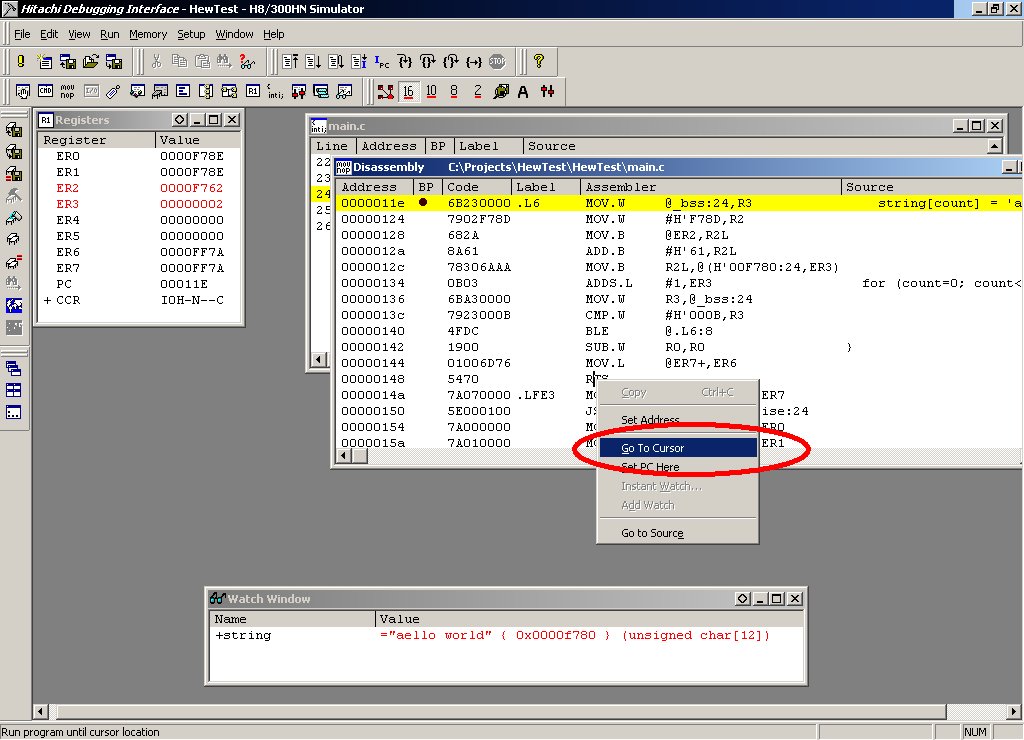
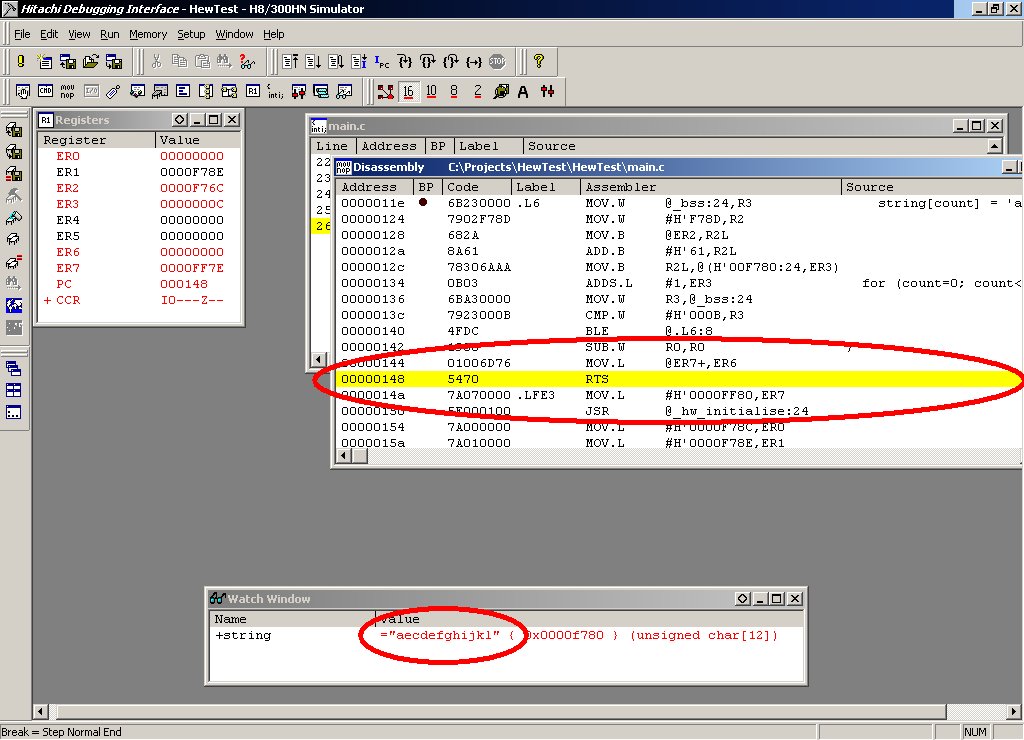
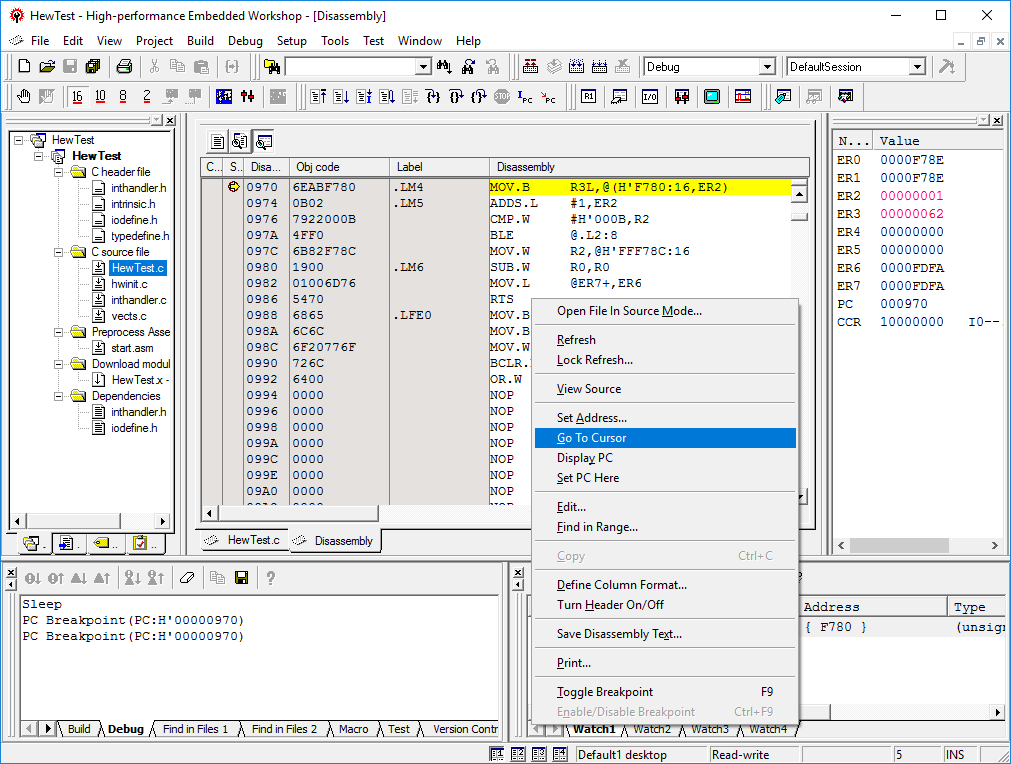
As a final demonstration of debugging, we will execute a specific range of instructions starting from the highlighted instruction. Close the “Breakpoints” view using the “X” button at the top left of the view. Now position the mouse pointer over the “Disassembly” window and click the left mouse button. Locate the “RTS instruction” at address its address. Position the mouse pointer over the instruction and click the right mouse button and select “Go To Cursor” from the context menu.
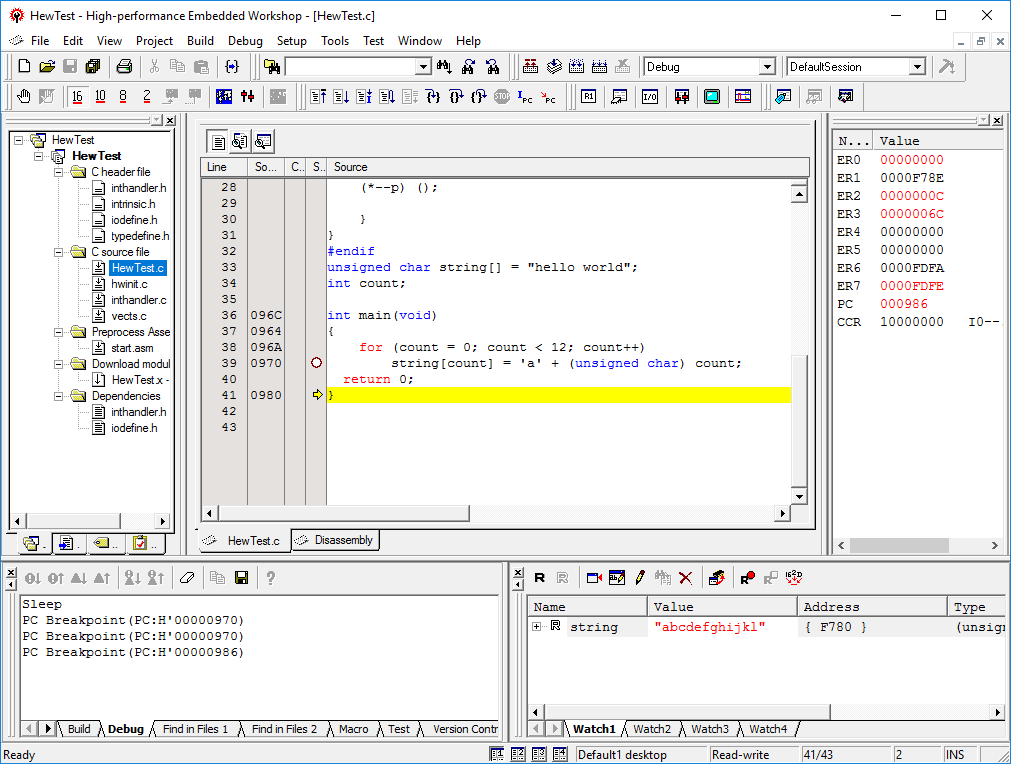
If you will return to the C source code you will see that the yellow arrow indicate that execution stopped just before exiting the main instruction. Notice also that the “string” variable in the watch window now shows the value “abcdefghijkl” and the register values have changed once more.
This completes the HEW2 debugging interface tutorial. Note that you can use the “Save Session” item in the “File” menu on the menu bar to save your entire session including simulator configuration and window layout. This will save you having to reconfigure these settings each time you debug your code.
In the tutorial we selected a CPU target, configured the target’s memory and loaded a simple application which we then debugged at both C and assembly level. We used the basic breakpoint, execution and watch features of HEW.